Community Articles
- Cloudera Community
- Support
- Community Articles
- Big Data Processing Engines, The Technical Series ...
- Subscribe to RSS Feed
- Mark as New
- Mark as Read
- Bookmark
- Subscribe
- Printer Friendly Page
- Report Inappropriate Content
- Subscribe to RSS Feed
- Mark as New
- Mark as Read
- Bookmark
- Subscribe
- Printer Friendly Page
- Report Inappropriate Content
Created on 01-03-2019 04:55 PM - edited 09-16-2022 01:45 AM
This article series is an expansion into the technical details behind the Big Data Processing Engines blog post: https://hortonworks.com/blog/big-data-processing-engines-which-one-do-i-use-part-1/
Intro to performance analysis
Here, we will be deep diving into the performance side of the three Big Data Processing Engines discussed in the above blog post: Druid, HBase, and Hive. I ran a number of query types to represent the various workloads generally executed on these processing engines, and measured their performance in a consistent manner. I ran a few tests on each of the three engines to showcase their different strengths, and show where some are less effective (but could still fill the gap in a pinch).
We will be executing the following queries:
- Simple count of all records in a table, highlighting aggregation capabilities
- A select with a where clause, highlighting drill-down and "needle in the haystack" OLTP queries
- A join, showcasing ad-hoc analysis across the dataset
- Updates, showcasing scenarios in which data is constantly changing and our dataset needs to stay up to date Performance Analysis
- An aggregation much like an analyst would do, such as summing data on a column
Performance Analysis
A few notes about setup:
- Data size: 200 million rows, 30GB on disk (90GB after replication)
- Cluster size: 8 nodes, broken down into 2 masters and 6 workers
- Node size: 8 core, 16 GB RAM machines in a virtualized environment
- Method of querying: Hive on Tez+LLAP was used to query Hive-managed and Druid-managed data. Phoenix was used to query HBase-managed data. A reasonable configuration was used for each of the engines
- Cache was taken out of the picture in order to get accurate estimates for initial query execution. Query execution and re-execution times will be much faster with cache in place for each of these engines
Note that this is not an ideal setup for Hive+HBase+Druid. Dedicated nodes for each of these services would yield better numbers but we decided to keep it approachable so you can reproduce these results on your own small cluster. As I laid out, the three processing engines performed about how you would expect given their relative strengths and weaknesses. Take a look at the table below.
| Query | HBase/Phoenix (seconds) | Hive (seconds) | Druid (seconds) |
| Count(*) | 281.44 | 4.72 | 0.71 |
| Select with filter | 1.35 | 8.71 | 0.34 |
| Select with join and filter | 365.41 | 9.16 | N/A |
| Update with filter | 1.52 | 9.75 | N/A |
| Aggregation with filter | 353.07 | 8.66 | 1.72 |
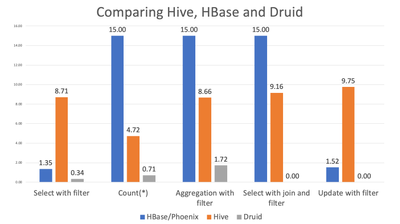
Here is that same information in a graph format, with HBase capped at 15s to keep the scale readable.
As expected, HBase outshined the other two when it came to ACID operations, with an average of 1.5 seconds on the updates. Druid is not capable of them and Hive took a bit longer. HBase however is not great at aggregation queries, as seen in the ~6 minute query times. Druid is extremely efficient at everything it does, giving no results above 2 seconds and mostly under 1 second. Lastly, Hive with its latest updates has become a real-time database and serviced all queries thrown at it in under 10 seconds.
Queries
Here are all of the queries that were run, multiple times each, to arrive at the results above.
--queries

select count(*) from transactions;
select count(*) from transactions_hbase;
select count(*) from transactions_druid;

select trxn_amt,rep_id from transactions_partitioned where trxn_date="2018-10-09" and trxn_hour=0 and trxn_time="2018-10-09 00:33:59.07";
select * from transactions_hbase_simple where row_key>="2018-09-11 12:03:05.860" and row_key<"2018-09-11 12:03:05.861";
select * from transactions_druid where `__time`='2018-09-11 12:03:05.85 UTC';

select distinct(b.name) from transactions_partitioned a join rep b on a.rep_id=b.id where rep_id in (1,2,3) and trxn_amt > 180;
select distinct b."name" from "transactions_hbase" a join "rep_hbase" b on a."rep_id"=b."ROW_KEY" where b."ROW_KEY" in (1,2,3) and a."trxn_amt">180.0;

update transactions_partitioned set qty=10 where trxn_date="2018-10-09" and trxn_hour=0 and trxn_time>="2018-10-09 00:33:59.07" and trxn_time<"2018-10-09 00:33:59.073";
insert into table transactions_hbase_simple values ('2018-09-11 12:03:05.860~xxx-xxx~xxx xxx~1~2017-02-09', null,null,null,10,null,null,null);

select sum(trxn_amt),rep_id from transactions_partitioned group by rep_id;
select sum("trxn_amt"),"rep_id" from "transactions_hbase" group by "rep_id";
select sum(trxn_amt),rep_id from transactions_druid group by rep_id;


