Community Articles
- Cloudera Community
- Support
- Community Articles
- Comprehensive understanding of "No GC" pauses in h...
- Subscribe to RSS Feed
- Mark as New
- Mark as Read
- Bookmark
- Subscribe
- Printer Friendly Page
- Report Inappropriate Content
- Subscribe to RSS Feed
- Mark as New
- Mark as Read
- Bookmark
- Subscribe
- Printer Friendly Page
- Report Inappropriate Content
Created on
04-18-2024
04:41 AM
- edited on
04-18-2024
10:09 PM
by
VidyaSargur
Introduction
Apache Hadoop's efficiency and reliability significantly depend on the Java Virtual Machine (JVM)'s performance. To assist in monitoring and analyzing JVM pauses, especially those induced by Garbage Collection (GC), Hadoop integrates a utility named JvmPauseMonitor, a Hadoop common class introduced by https://issues.apache.org/jira/browse/HADOOP-9618 and widely used in Hadoop projects like HDFS, Hbase, Yarn, Oozie, MapReduce, etc.
Overview of JvmPauseMonitor
Key Features and Implementation
private String formatMessage(long extraSleepTime,

      Map<String, GcTimes> gcTimesAfterSleep,

      Map<String, GcTimes> gcTimesBeforeSleep) {


    Set<String> gcBeanNames = Sets.intersection(

        gcTimesAfterSleep.keySet(),

        gcTimesBeforeSleep.keySet());

    List<String> gcDiffs = Lists.newArrayList();

    for (String name : gcBeanNames) {

      GcTimes diff = gcTimesAfterSleep.get(name).subtract(

          gcTimesBeforeSleep.get(name));

      if (diff.gcCount != 0) {

        gcDiffs.add("GC pool '" + name + "' had collection(s): " +

            diff.toString());

      }

    }


    String ret = "Detected pause in JVM or host machine (eg GC): " +

        "pause of approximately " + extraSleepTime + "ms\n";

    if (gcDiffs.isEmpty()) {

      ret += "No GCs detected";

    } else {

      ret += Joiner.on("\n").join(gcDiffs);

    }

    return ret;

  }
Monitoring Cycle:
It executes a sleep-wake cycle, periodically sleeping through the Thread.sleep(SLEEP_INTERVAL_MS) call, comparing the intended sleep duration against the actual elapsed time to identify JVM pauses.
SLEEP_INTERVAL_MS is defined as:
private static final long SLEEP_INTERVAL_MS = 500;
Evaluation of GC Metrics:
It assesses garbage collection metrics before and after the sleep interval to determine whether GC activities contributed to the detected pauses.
Compute Diff:
diff is computed by subtracting the GC metrics captured before the sleep (gcTimesBeforeSleep) from those after the sleep (gcTimesAfterSleep) for each garbage collector identified by name.
Determine GC type:
If GC events happened, the diff.gcCount variable will be positive, then logged as "GC pause ".
If no GC events are happening during the sleep interval, the diff.gcCount variable will be zero, then it is "No GC"
Logging Thresholds:
JvmPauseMonitor uses configurable thresholds (INFO_THRESHOLD_DEFAULT = 1000 for info-level logs and WARN_THRESHOLD_DEFAULT = 10000 for warn-level logs) to categorize the severity of detected pauses.
Understanding "GC" and "No GC"
"GC" Detected: If the difference (diff) in GC metrics (count and time) before and after the pause indicates an increase, it signifies that GC events occurred during the pause. These events are detailed in the log message, specifying which GC pools were active and the extent of their activity.
if (diff.gcCount != 0) {

  gcDiffs.add("GC pool '" + name + "' had collection(s): " + diff.toString());

}
"No GC" Detected: Conversely, if no significant differences in GC metrics are found (i.e., gcDiffs is empty), the pause is logged without attributing it to GC activities. This scenario suggests the pause was caused by factors other than garbage collection, such as OS-level scheduling delays.
if (gcDiffs.isEmpty()) {

  ret += "No GCs detected";

}
GC logging/debug:
Add the below parameters to JVM params, which usually can be added to java_opts in the Role's Configuration in CM.
Basic logging parameters for performance tuning:
-verbose:gc

-XX:-PrintGCCause

-XX:+PrintGCDetails

-XX:+PrintAdaptiveSizePolicy

-XX:+PrintGCDateStamps
Additional parameters that may be used for more deep evaluation:
-XX:+PrintClassHistogramBeforeFullGC

-XX:+PrintClassHistogramAfterFullGC

-XX:+PrintReferenceGC

-XX:+PrintTenuringDistribution
Either you can analyze the collected GC logs directly or use some tools like GCEasy(https://gceasy.io/)
Possible Reasons
Possible reasons for "GC" pauses inside JVMs are
- Heap Size and Utilization problem
- Improper GC parameters
- JVM threads are overloaded
- Known bugs or memory leaks
Many articles explain JVM GC issues, so we discuss it less here.
Possible reasons for the "No GC" pause:
It implies that garbage collection activities didn't cause the pause. Several factors outside of GC can lead to such pauses
- Operating System Pauses
The application or the JVM process might be paused due to the operating system's actions, such as swapping memory to disk, other processes consuming excessive CPU resources, or OS-level maintenance tasks.
- Using uptime , iostat , sar to find the OS utilization pattern.
- Check the /var/log/message and `dmesg -T` for warnings from kernel
- Cloudera Manager host charts, e.g. load average, Disk, and Network utilization.
- Review the Diagnostic Bundle Alerts and health checks from CSI
- Hardware Issues
Underlying hardware problems, such as failing disks, network issues, or memory errors, can lead to pauses in the JVM as it waits for IO operations or encounters hardware errors.
- External System Calls
Calls to external systems or services, especially those that involve network communication or disk access, can introduce delays. If these calls block the main application threads, they can result in pauses not attributed to GC.
Example Case of a "No GC" pause that causes Namenode to crash
Log snippets:
"No GC pause happened"
2024-02-25 21:31:27,854 INFO org.apache.hadoop.util.JvmPauseMonitor: Detected pause in JVM or host machine (eg GC): pause of approximately 7861ms

No GCs detected

2024-02-25 21:31:35,704 INFO org.apache.hadoop.util.JvmPauseMonitor: Detected pause in JVM or host machine (eg GC): pause of approximately 7350ms

No GCs detected
NN is not responsive to sendEdits through QuorumjournalManager
2024-02-25 21:31:36,703 INFO org.apache.hadoop.hdfs.qjournal.client.QuorumJournalManager: Waited 8849 ms (timeout=20000 ms) for a response for sendEdits. No responses yet.

2024-02-25 21:31:37,703 INFO org.apache.hadoop.hdfs.qjournal.client.QuorumJournalManager: Waited 9850 ms (timeout=20000 ms) for a response for sendEdits. No responses yet.

2024-02-25 21:31:38,704 INFO org.apache.hadoop.hdfs.qjournal.client.QuorumJournalManager: Waited 10851 ms (timeout=20000 ms) for a response for sendEdits. No responses yet.

2024-02-25 21:31:39,706 INFO org.apache.hadoop.hdfs.qjournal.client.QuorumJournalManager: Waited 11852 ms (timeout=20000 ms) for a response for sendEdits. No responses yet.
NN is fenced
2024-02-25 21:31:43,517 ERROR org.apache.hadoop.hdfs.server.namenode.FSEditLog: Error: flush failed for required journal

2024-02-25 21:32:13,947 INFO org.apache.hadoop.hdfs.server.namenode.NameNode: SHUTDOWN_MSG:
Charts
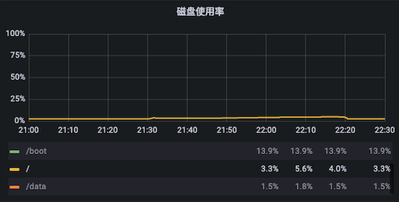
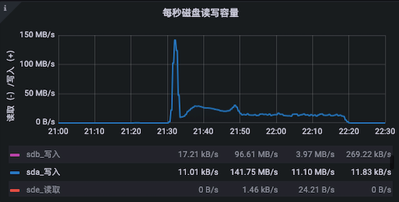
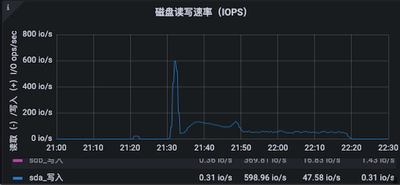
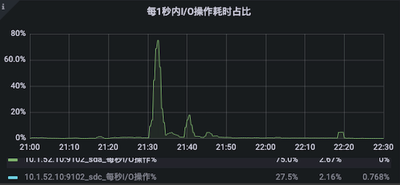
The "No GC" is due to a sudden write I/O on /root directory (sys disk) observed from Grafana:
(Chart 1) Disk utilization of directories
(Chart 2) Disk write I/O capacity per second
(Chart 3) Disk write IOPS
(Chart 4) Disk I/O operation time in 1 second
We found there's a cron job that runs "hdfs oiv" command to parse fsimage into fsimage.csv but it is generating the big csv file at /root directory which is the system disk causing the sudden I/O peak further causing the "No GC"


