Community Articles
- Cloudera Community
- Support
- Community Articles
- Creating a Kibana dashboard of Twitter data pushed...
- Subscribe to RSS Feed
- Mark as New
- Mark as Read
- Bookmark
- Subscribe
- Printer Friendly Page
- Report Inappropriate Content
- Subscribe to RSS Feed
- Mark as New
- Mark as Read
- Bookmark
- Subscribe
- Printer Friendly Page
- Report Inappropriate Content
Objectives:
This article will walk you through the process of creating a dashboard in Kibana using Twitter data that was pushed to Elasticsearch via NiFi. The tutorial will also cover basics of Elasticsearch mappings and templates.
Prerequisites:
- You should already have installed the Hortonworks Sandbox (HDP 2.5 Tech Preview).
- You should already have completed the NiFi + Twitter + Elasticsearch tutorial here: HCC Article
- Make sure your GetTwitter and PutElasticsearch processors in your NiFi data flow are stopped.
NOTE: While not required, I highly recommend using Vagrant to manage multiple Virtualbox environments. You can read more about converting the HDP Sandbox Virtualbox virtual machine into a Vagrant box here: HCC Article
Scope
This tutorial was tested using the following environment and components:
- Mac OS X 10.11.6
- HDP 2.5 Tech Preview on Hortonworks Sandbox
- Apache NiFi 1.0.0 (Read more here: Apache NiFi)
- Elasticsearch 2.3.5 and Elasticsearch 2.4.0 (Read more here: Elasticsearch)
- Kibana 4.6.1 (Read more here: Kibana)
- Vagrant 1.8.5 (Read more here: Vagrant)
- VirtualBox 5.1.4 and VirtualBox 5.1.6 (Read more here: VirtualBox)
Steps
Download Kibana
I assume you are using Vagrant to connect to your sandbox. As noted in the prerequisites, it is not required but is very handy.
$ vagrant ssh
Now download the Kibana software:
$ cd ~
$ curl -O https://download.elastic.co/kibana/kibana/kibana-4.6.1-linux-x86_64.tar.gz
Install Kibana
We will be running Kibana out of the /opt directory. So extract the archive there:
$ cd /opt
$ sudo tar xvfz ~/kibana-4.6.1-linux-x86_64.tar.gz
We will be using the elastic user, which you should have created in the prerequisite tutorial. So we need to change ownership of the Kibana files to the elastic user:
$ sudo chown -R elastic:elastic /opt/kibana-4.6.1-linux-x86_64
Configure Kibana
Before making any configuration changes, switch over to the elastic user:
$ sudo su - elastic
The Kibana configuration file is kibana.yml and it's located in the config directory. We need to edit this file:
$ cd /opt/kibana-4.6.1-linux-x86_64
$ vi config/kibana.yml
Kibana defaults to port 5601, but we want to set it explicitly. This port should not conflict with anything on the sandbox.
Uncomment this line:
#server.port: 5601
It should look like this:
server.port: 5601
We want to explicitly tell Kibana to listen to the host ip address of sandbox.hortonworks.com:
Uncomment this line:
#server.host: "0.0.0.0"
Change it to this:
server.host: sandbox.hortonworks.com
We also want to explicitly set the Elasticsearch host.
Uncomment this line:
#elasticsearch.url: "http://localhost:9200"
Change it to this:
elasticsearch.url: "http://sandbox.hortonworks.com:9200"
Save the file
Press Esc
!wq
Start Kibana
Now we can start Kibana. The archive file does not provide a service script, so we'll run it by hand.
$ bin/kibana
You should see something similar to:
$ bin/kibana
  log   [17:32:15.415] [info][status][plugin:kibana@1.0.0] Status changed from uninitialized to green - Ready
  log   [17:32:15.473] [info][status][plugin:elasticsearch@1.0.0] Status changed from uninitialized to yellow - Waiting for Elasticsearch
  log   [17:32:15.498] [info][status][plugin:kbn_vislib_vis_types@1.0.0] Status changed from uninitialized to green - Ready
  log   [17:32:15.518] [info][status][plugin:markdown_vis@1.0.0] Status changed from uninitialized to green - Ready
  log   [17:32:15.523] [info][status][plugin:metric_vis@1.0.0] Status changed from uninitialized to green - Ready
  log   [17:32:15.527] [info][status][plugin:spyModes@1.0.0] Status changed from uninitialized to green - Ready
  log   [17:32:15.532] [info][status][plugin:statusPage@1.0.0] Status changed from uninitialized to green - Ready
  log   [17:32:15.535] [info][status][plugin:table_vis@1.0.0] Status changed from uninitialized to green - Ready
  log   [17:32:15.540] [info][listening] Server running at http://sandbox.hortonworks.com:5601
  log   [17:32:20.594] [info][status][plugin:elasticsearch@1.0.0] Status changed from yellow to yellow - No existing Kibana index found
  log   [17:32:23.379] [info][status][plugin:elasticsearch@1.0.0] Status changed from yellow to green - Kibana index ready
Access Kibana Web UI
You can access the Kibana web user interface via your browser:
http://sandbox.hortonworks.com:5601
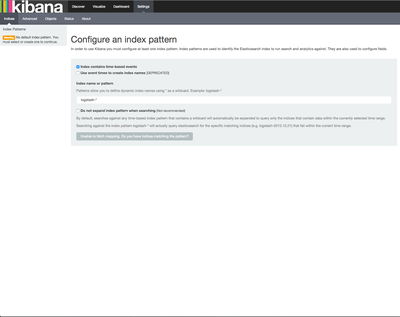
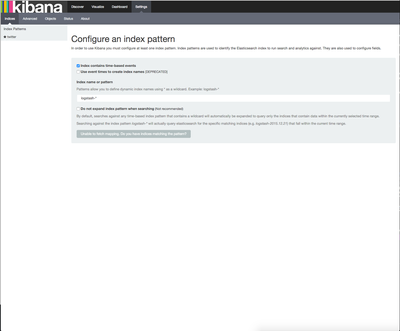
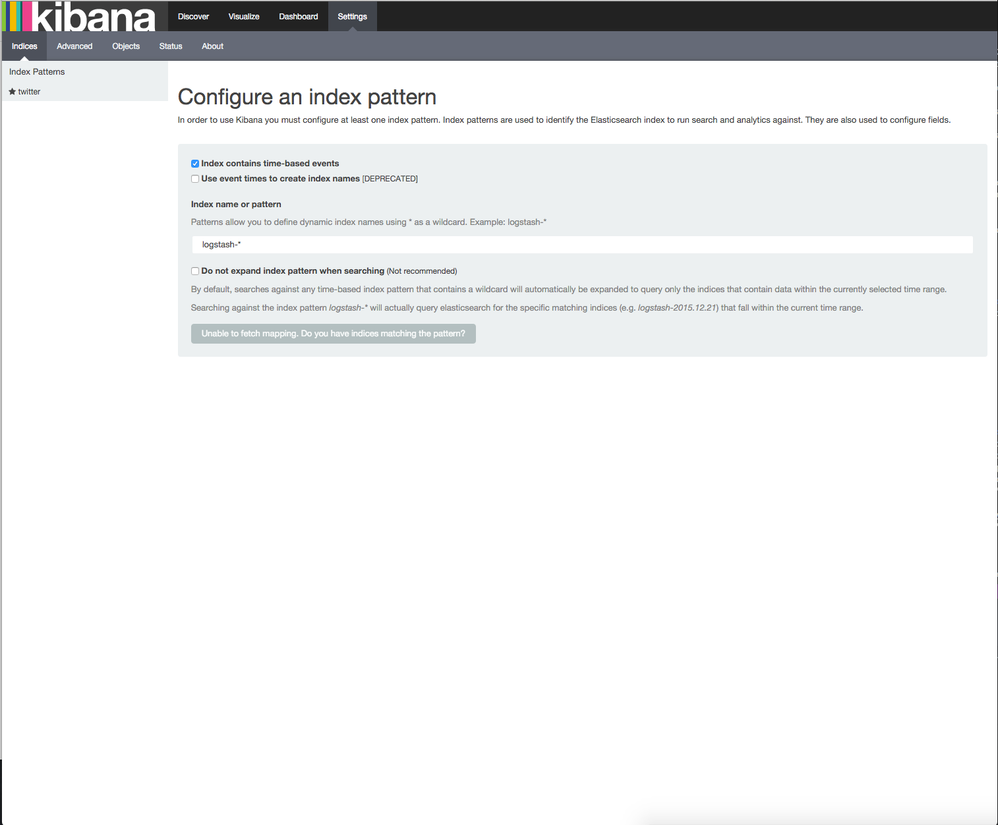
When you first start Kibana, it will create a new Elasticsearch index called .kibana where it stores the visualizations and dashboards. Because this is the first time starting it, you should be prompted to configure an index pattern. You should see something similar to:
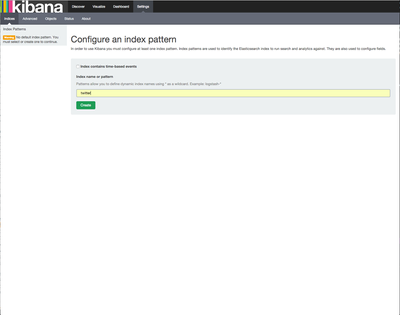
We are going to use our Twitter data which is stored in the twitter index. Uncheck the Index contains time-based events option. Our data is not yet properly setup to handle time-based events. We'll fix this later. Replace logstash-* with twitter.
You should see something similar to this:
If everything looks correct, click green Create button.
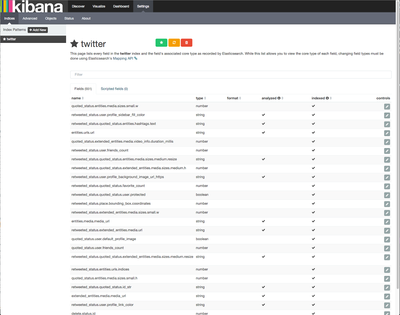
Kibana will now show you the index definition for the twitter index. You can see all of the fields names, their data types and if the fields are analyzed and indexed. This provides a good high level overview of the data configuration in the index. You can also filter fields in the filter box. You should see something similar to this:
At this point, your index pattern is saved. You can now start discovering your data.
Discover Twitter Data
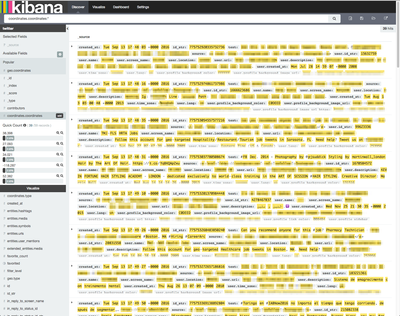
Click on the Discover link in the top navigation bar. This opens the Discover view which is a very helpful way to dive into your raw data. You should see something similar to this:
At the top of the screen is the query box which allows you to filter your data based on search terms. Enter coordinates.coordinates:* in the filter box to filter results that only contain that field. On the left of the screen is the list of fields in the index. Each field has an icon to the left of the field name that indicates the data type for the field. If you click on the field name, it will expand to show you sample data for that field in the index. Looked for the field named coordinates.coordinates. The icon to the left of that field indicates that it is a number field. If you click the name of the field, you can see that it expands. You should see something similar to this:
It shows the the percentage of documents where the value is present. You can experiment with other fields. Some fields will tell you the field is present in the mapping, but there are no values in the documents. Elasticsearch does not create empty fields.
The area to the right of the screen shows your current search results. The small triangle icon will expand the search result to show a more user friendly and detailed view of the record in the index. Click the arrow icon for the first result. You should see something similar to this:
Nested objects in the twitter data are easily seen as JSON objects. You can see entities.media, entities.urls, and entities.hashtags as examples of nested objects. This will depend on the data in your twitter index.
Update Elasticsearch Configuration
Before we can move on to creating visualizations, we need to update our Elasticsearch configuration. When we pushed Twitter data to Elasticsearch, you should remember that we didn't have to create the Elasticsearch index or define a mapping. Out of the box, Elasticsearch is very user friendly by dynamically evaluating your data and creating a best-guess data mapping for you. This is great for testing and evaluation as it makes the data discovery process much quicker.
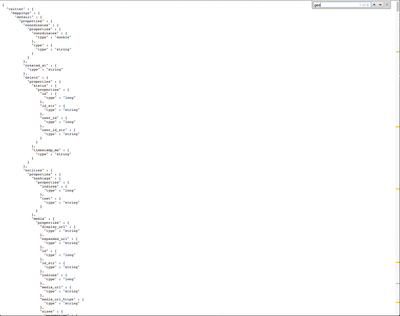
To see what the twitter index mapping looks like, enter this url into your browser:
http://sandbox.hortonworks.com:9200/twitter/_mapping?pretty
You can read more about Elasticsearch index mapping here: Elasticsearch Mapping. You should see something similar to this:
As you can see, the mapping is very long and somewhat complex. It can be very time consuming to go through this entire mapping and make changes to the fields that require a different analyzer or data type. You absolutely should do this for production data sets. However, for testing and evaluation of a new data set, we can start by creating a mapping with a much smaller subset of known fields. If you want to perform specific analysis such as geospatial queries or time-series queries, then you need to ensure your Elasticsearch index mapping is properly configured for those fields.
We can do this using Templates in Elasticsearch. You define a template with the mappings you care about. When a new index is created, Elasticsearch first looks for a matching template. If it finds one, it will create the index using the mapping in the template. For our purposes we will create a simple template mapping. By default Elasticsearch will fill in any of the new fields contained in the data that isn't in our mapping. It will do this by dynamically determining the data type. You can read more about templates here: Elasticsearch Templates
For our dashboard, we want to do time-series analysis, geo-spatial analysis and aggregations (grouping and counts) of fields. Each of these requires the field definition to be properly configured in the index mapping. You push the template to Elasticsearch as a JSON document using curl. Here is the template and command we'll be using:
$ curl -XPUT sandbox.hortonworks.com:9200/_template/twitter -d '
{
  "template" : "twitter*",
  "settings" : {
      "number_of_shards" : 1
  },
  "mappings" : {
    "default" : {
      "properties" : {
        "created_at" : {
          "type" : "date",
          "format" : "EEE MMM dd HH:mm:ss Z YYYY"
        },
        "coordinates" : {
          "properties" : {
            "coordinates" : {
              "type" : "geo_point"
            },
            "type" : {
              "type" : "string"
            }
          }
        },
        "user" : {
          "properties" : {
            "screen_name" : {
              "type" : "string",
              "index" : "not_analyzed"
            },
            "lang" : {
              "type" : "string",
              "index" : "not_analyzed"
            }
          }
        }
      }
    }
  }
}'
The twitter* in the "template" : section is a regular expression match. Any new index created with a name that starts with twitter, such as twitter_20160914 or twitter2016, will match the template. Elasticsearch will create those indexes with the mappings defined in the template.
The created_at field is the field on which we will do our time-series analysis. This field should be using a date data type. We also need to specify the data format to ensure Elasticsearch correctly parses the date. Here is that configuration for our data:
"created_at" : {
  "type" : "date",
  "format" : "EEE MMM dd HH:mm:ss Z YYYY"
}
Twitter data has two fields with geospatial data: geo.coordinates and coordinates.coordinates. The geo.coordinates field is in [lat,lon] format. The coordinates.coordinates field is in the [lon,lat] format. Elasticsearch requires data to be in the [lon,lat] format when passed as an array, as in our Twitter data. You can read more about it here (see note 4 for the example): Elasticsearch Geo-Point. Note this is a nested field which requires a nested mapping. Here is that configuration for our data:
"coordinates" : {
  "properties" : {
    "coordinates" : {
      "type" : "geo_point"
    },
    "type" : {
      "type" : "string"
    }
  }
}
For aggregations where we want to do counts, we also need a special configuration. We are going to use user.screen_name and user.lang. These fields were originally mapped as strings. Elasticsearch does stemming and tokenization of strings. For single terms, this generally isn't a problem, but will cause issues for multi-word terms we want to group as a single token. For example, a screen_name of my_screen_name would be converted to "my screen name" and won't be evaluated properly when doing aggregations on that field. Read more about that here: Elasticsearch Languages. To handle this scenario we need to tell Elasticsearch to not analyze those fields. This is done using the "index" : "not_analyzed" setting for a field. Here is that configuration for our data:
"user" : {
  "properties" : {
    "screen_name" : {
      "type" : "string",
      "index" : "not_analyzed"
    },
    "lang" : {
      "type" : "string",
      "index" : "not_analyzed"
    }
  }
}
You should have pushed this template to Elasticsearch using curl as shown above. You should get a response from Elasticsearch that looks like this:
{"acknowledged":true}
If you receive an error, double check your ' and " characters to ensure they were not replaced with "smart" versions when you copy/pasted the command.
You can't update the field mappings of data already in an index. You need to create a new index which will use the updated mapping and template. Elasticsearch has a handy Reindex API to copy data from one index to another. The cool thing about this approach is the raw data is copied, but the new index will use whatever mapipng is created from the new template. You can read more about it here: Elasticsearch Reindex API. You can reindex using the new template with a simple command:
$ curl -XPOST sandbox.hortonworks.com:9200/_reindex -d '
{
  "source": {
    "index": "twitter"
  },
  "dest": {
    "index": "twitter_new"
  }
}'
Depending on the size of your index, this could take a few minutes. When it is complete, you will should see something similar to this:
{"took":34022,"timed_out":false,"total":37114,"updated":0,"created":37114,"batches":38,"version_conflicts":0,"noops":0,"retries":0,"throttled_millis":0,"requests_per_second":"unlimited","throttled_until_millis":0,"failures":[]}
On my virtual machine it took 34 seconds for 37,114 records.
Update Kibana Index Pattern
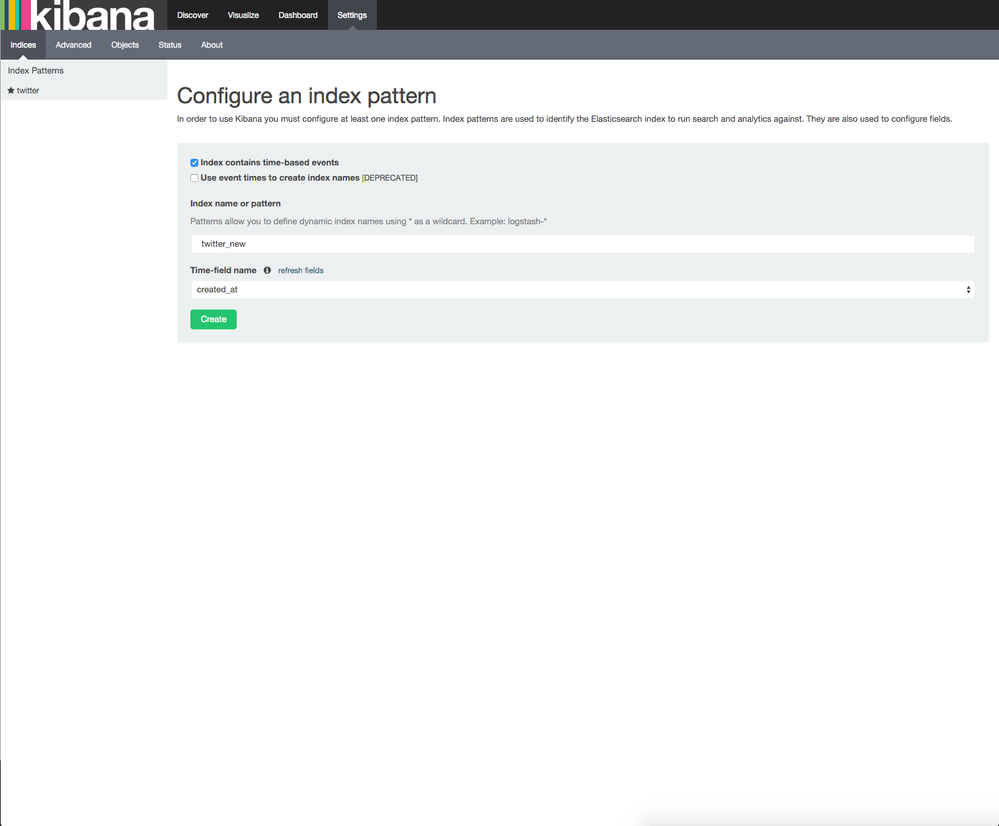
Now that we have a new index, we need to create a new index pattern in Kibana. Click on the Settings link in the navigation bar in Kibana. You should the Configure an index pattern screen. If you do not, click on the Indices link. You should see something similar to this:
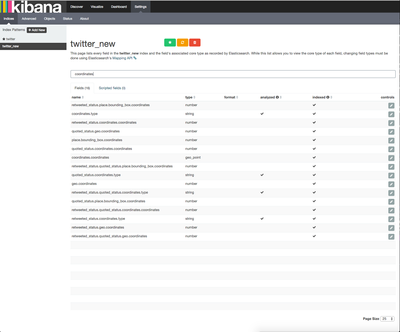
You should notice our existing Twitter* Index Pattern on the left. We need to create an index pattern for the twitter_new index we created with the Reindex API. Keep the Index contains time-based events option check this time. Enter twitter_new for the index name. You will noticed that Kibana auto populated the time-field name with created_at, which is what we want. Click the green Create button.
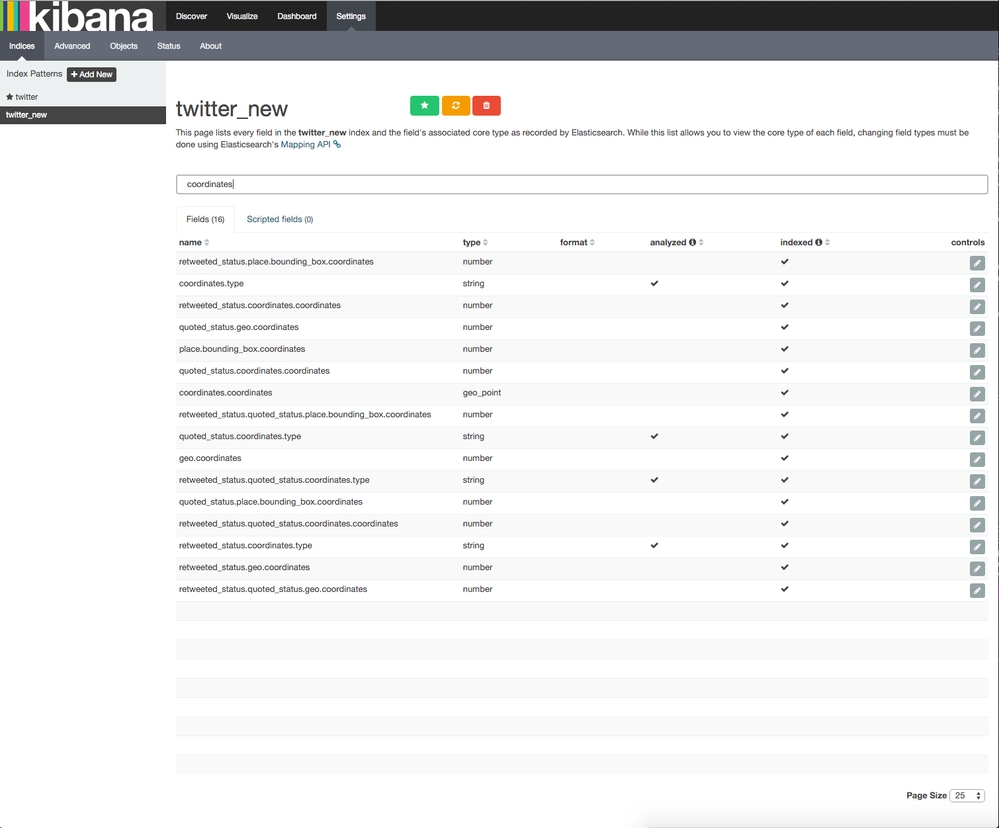
As before, you will see the index definition from Elasticsearch. In the filter query box, enter coordinates. This will filter the fields and only display those fields that have coordinates in the field name. You should see something similar to this:
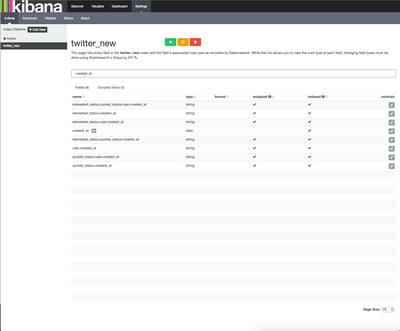
Notice how the coordinates.coordinates field has type geo_point? Now filter on created_at. You should see something similar to this:
Notice how created_at has a clock icon and the type is date. This tells us the new index has the updated field mappings. Now we can create some visualizations.
Create Kibana Visualizations
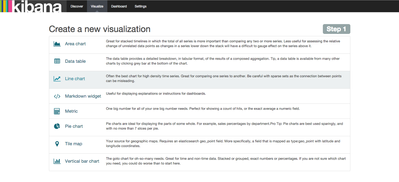
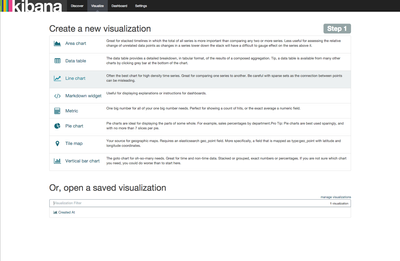
Now that our index is properly configured, we can create some visualizations. Click on the Visualize link in the navigation bar. You should see something similar to this:
We are going to create a time-series chart. So click on Vertical bar chart. You should see something similar to this:
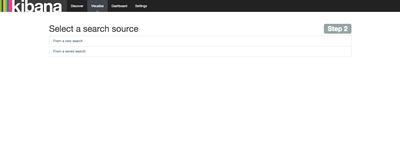
Now click on From a new search. You should see something similar to this:
Kibana knows you have two index patterns and is prompting you to specify which one to use for the visualization. In the Select an index pattern drop down, choose twitter_new. You should see something similar to this:
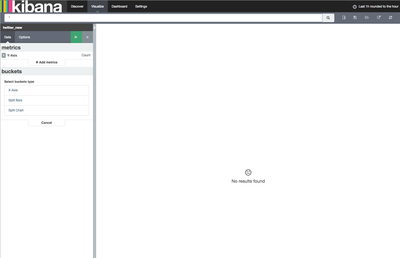
The Y-Axis defaults to Count, which is fine. We need to tell Kibana what field to use for the X-Axis. Under Select buckets type click on X-Axis. You should see something similar to this:
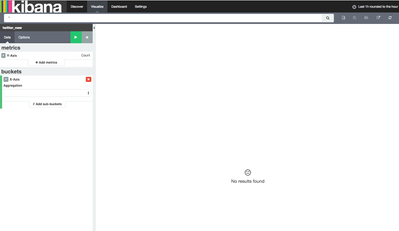
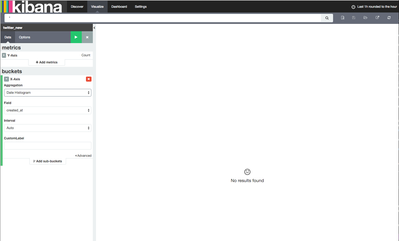
Under Aggregation, expand the drop down and select Date Histogram. Your screen should look like this:
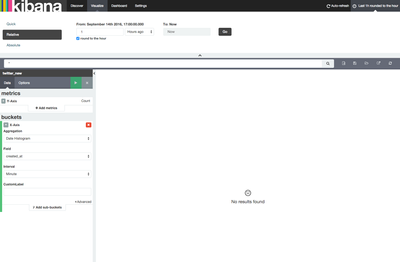
You will notice that it defaulted to using the created_at field which is the time-series field we selected for the index pattern. This is what we want. By default, Kibana will filter events to show only the last hour. In the upper right corner of the UI, click the Last 1h rounded to the hour text. This will expand the time picker. You should see something like this:
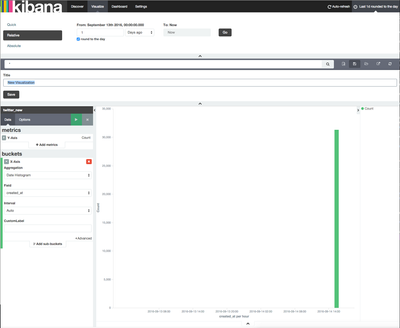
Change the time option from 1 hours ago to 1 days ago. Click the gray Go button. Now we can save this visualization. Click the floppy disk icon to the right of the query box. You should see something similar to this:
Give the visualization a name of Created At and click the gray Save button.
Now we are going to create a map visualization. Click the Visualize link in the navigation Bar. You should see something like this:
You should note our previously saved visualization is listed at the bottom. Now we are going to click on the Tile map option. You want to choose From a new search and use the index pattern twitter_new. You should have something that looks similar to this:
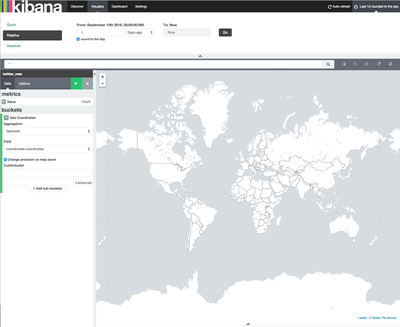
Under the Select buckets type, click on Geo Coordinates. Kibana should auto populate the values with the only geo-enabled field we have, coordinates.coordinates. You should see something similar to this:
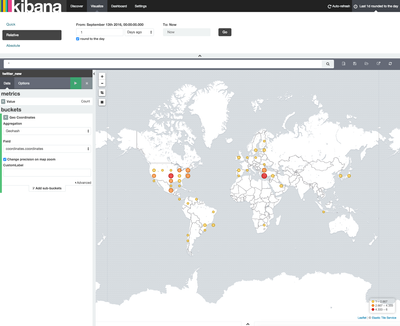
Click the Green run arrow. You should see something similar to this:
Now save the visualization, like we did the last one. Name it Twitter Location.
Create Kibana Dashboard
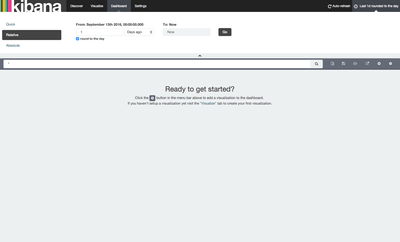
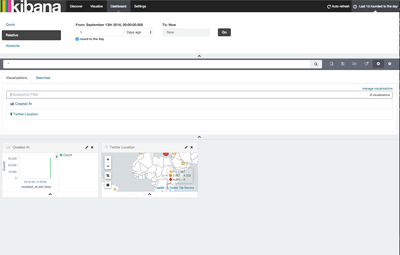
Now we ready to create a Kibana dashboard. Click on Dashboard in the navigation bar. You should see something similar to this:
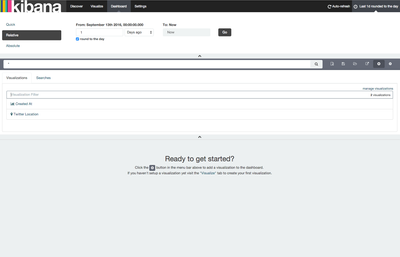
Click the + icon where it says Ready to get started?. You should see something similar to this:
You should see the two visualizations listed that we saved. You add them to the dashboard by clicking the name of the visualization. Click each of the visualizations one time. You should see something similar to this:
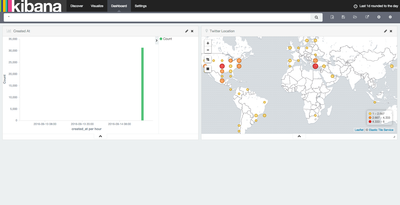
You can resize each of the dashboard tiles by dragging the lower right corner of each tile. Increase the size of each tile so they take up half of the vertical space. You will notice the tiles show a shaded area where they will auto size to the next closest size. You can click the ^ icon at the bottom of the visualization list to close it. You can do the same thing at the top for the date picker. You should have something similar to this:
Now we can save this dashboard. Click the floppy icon to the right of the query box. Save the dashboard as " Twitter Dashboard". Leave the Store time with dashboard option unchecked. This stores the currently selected time, which is 1 day ago. We want the dashboard to default to the current last 1 hour of data when opening the dashboard.
Review
We have successfully walked through installing Kibana on our sandbox. We created a custom template for the Twitter data in Elasticsearch. We used the Elasticsearch Reindex API to copy our index with the new mappings. We created two visualizations and a dashboard.
Next Steps
Now go back to your NiFi data flow and update the configuration of your PutElasticsearch processor to use the new index twitter_new instead of twitter. Turn on your data flow and refresh your dashboard to see how it changes over time.
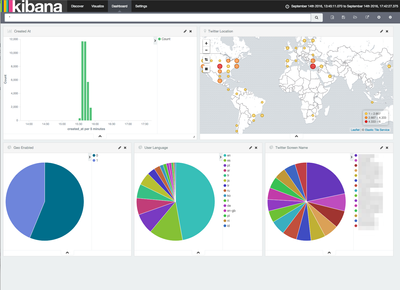
For extra credit, see if you can create a dashboard that looks similar to this:
Created on 09-16-2016 03:30 AM
- Mark as Read
- Mark as New
- Bookmark
- Permalink
- Report Inappropriate Content
Great article!
