Our Community is getting an upgrade! To get everything ready for the relaunch, we’ll be placing the site in read-only mode starting September 21st.
We really appreciate your understanding while we get things set up behind the scenes. Catch up on all the exciting details about the move here.
Need help or have questions? Drop us a line at [email protected]
Created on
09-05-2023
03:33 PM
- edited on
04-20-2026
11:49 PM
by
GrazittiAPI
The primary garbage collection challenge often arises when the heap configuration of the Namenode or Datanode is inadequate. GC pauses can trigger Namenode crash, failovers, and performance bottlenecks. In larger clusters, there is no response at the time of transitioning to an another Namenode.
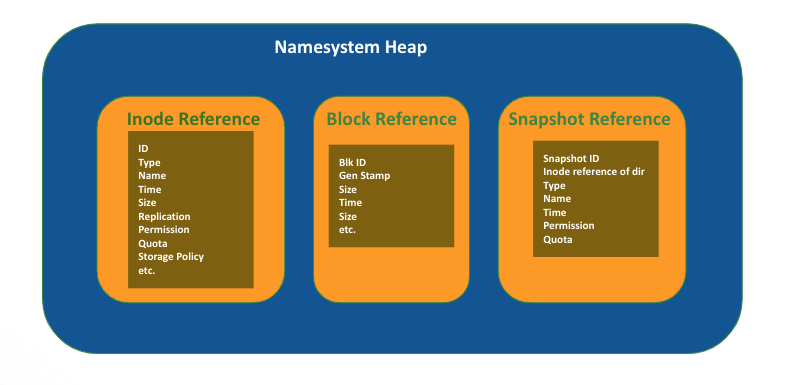
The Namenode comprises three layers of management:
All of these layers are stored in the Namenode in-memory heap, and any substantial modifications to them can lead to increased heap usage.
Similarly, the Datanode also maintains block mapping information in its memory.
<inode>
<id>26890</id>
<type>DIRECTORY</type>
<name>training</name>
<mtime>1660512737451</mtime>
<permission>hdfs:supergroup:0755</permission>
<nsquota>-1</nsquota><dsquota>-1</dsquota>
</inode>
<inode>
<id>26893</id>
<type>FILE</type>
<name>file1</name>
<replication>3</replication>
<mtime>1660512801514</mtime>
<atime>1660512797820</atime>
<preferredBlockSize>134217728</preferredBlockSize>
<permission>hdfs:supergroup:0644</permission>
<storagePolicyId>0</storagePolicyId>
</inode>
<blocks>
<block><id>1073751671</id><genstamp>10862</genstamp><numBytes>134217728</numBytes></block>
<block><id>1073751672</id><genstamp>10863</genstamp><numBytes>134217728</numBytes></block>
<block><id>1073751673</id><genstamp>10864</genstamp><numBytes>134217728</numBytes></block>
<block><id>1073751674</id><genstamp>10865</genstamp><numBytes>134217728</numBytes></block>
<block><id>1073751675</id><genstamp>10866</genstamp><numBytes>134217728</numBytes></block>
<block><id>1073751676</id><genstamp>10867</genstamp><numBytes>134217728</numBytes></block>
<block><id>1073751677</id><genstamp>10868</genstamp><numBytes>116452794</numBytes></block>
</blocks>
<SnapshotSection>
<snapshotCounter>1</snapshotCounter>
<numSnapshots>1</numSnapshots>
<snapshottableDir>
<dir>26890</dir>
</snapshottableDir>
<snapshot>
<id>0</id>
<root>
<id>26890</id>
<type>DIRECTORY</type>
<name>snap1</name>
<mtime>1660513260644</mtime>
<permission>hdfs:supergroup:0755</permission>
<nsquota>-1</nsquota>
<dsquota>-1</dsquota>
</root>
</snapshot>
</SnapshotSection>
High heap usage can be caused by several factors, including:
| WARN [JvmPauseMonitor] util.JvmPauseMonitor: Detected pause in JVM or host machine (eg GC): pause of approximately 143694ms GC pool 'ParNew' had collection(s): count=1 time=0ms GC pool 'ConcurrentMarkSweep' had collection(s): count=2 time=143973ms |
| WARN [JvmPauseMonitor] util.JvmPauseMonitor: Detected pause in JVM or host machine (eg GC): pause of approximately 83241ms No GCs detected |
INFO org.apache.hadoop.hdfs.server.namenode.FSNamesystem:
Number of suppressed read-lock reports: 0
Longest read-lock held at xxxx for 143973ms via java.lang.Thread.getStackTrace(Thread.java:1559)
org.apache.hadoop.util.StringUtils.getStackTrace(StringUtils.java:1058)
org.apache.hadoop.hdfs.server.namenode.FSNamesystemLock.readUnlock(FSNamesystemLock.java:187)
org.apache.hadoop.hdfs.server.namenode.FSNamesystem.readUnlock(FSNamesystem.java:1684)
org.apache.hadoop.hdfs.server.namenode.ContentSummaryComputationContext.yield(ContentSummaryComputationContext.java:134)
..
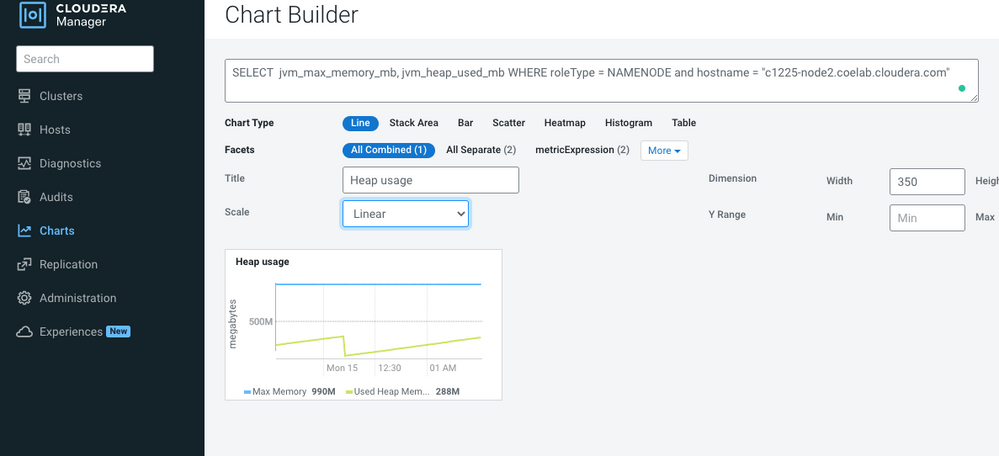
Cloudera Manager -> Charts -> Chart Builder ->
SELECT jvm_gc_rate WHERE roleType = NAMENODE and hostname = "<problamatic namenode hostname>"
SELECT jvm_max_memory_mb, jvm_heap_used_mb WHERE roleType = NAMENODE and hostname = "<problamatic namenode hostname>"