Community Articles
- Cloudera Community
- Support
- Community Articles
- Generic Steps of Understanding/ Debugging Services...
- Subscribe to RSS Feed
- Mark as New
- Mark as Read
- Bookmark
- Subscribe
- Printer Friendly Page
- Report Inappropriate Content
- Subscribe to RSS Feed
- Mark as New
- Mark as Read
- Bookmark
- Subscribe
- Printer Friendly Page
- Report Inappropriate Content
Created on 07-31-2018 07:40 PM - edited 08-17-2019 06:49 AM
The general perception that one needs to thoroughly know the code base for Understanding and Debugging a HDP service. Do appreciate the fact that HDP services including the execution engine (MR, TEZ, SPARK) are all JVM based processes. JVM along with the Operating Systems provides various knobs to know what the process is doing and performing at run-time.
The steps mentioned below can be applied for understanding and debugging any JVM process in general.
Lets take an example of how HiveServer2 works assuming one is not much acquainted or has a deep understanding of the code base. We are assuming one knows what the service does, but how it works internally the user is not aware of
1. Process Resource Usage
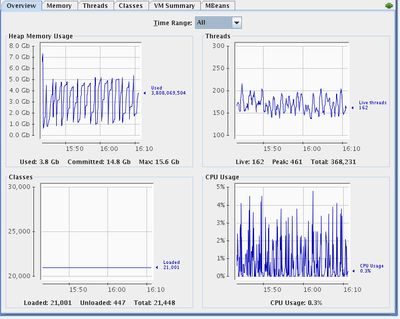
Gives a complete overview of the usage pattern of CPU, memory by the process providing a quick insight of the health of the process
2. How to figure out which all service the process interacts with
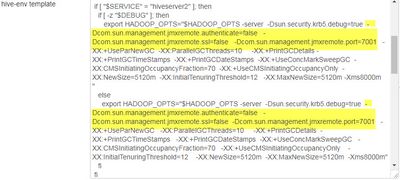
ADD JMX parameters to the service allowing you to visualize whats happening within the JVM at run-time using jconsole or jvisualm
What this ensures is the JVM is broadcasting the metrics on port 7001 and can be connected using jconsole or Jvisualm. There is no security enabled on can add SSL certificates too for authentication
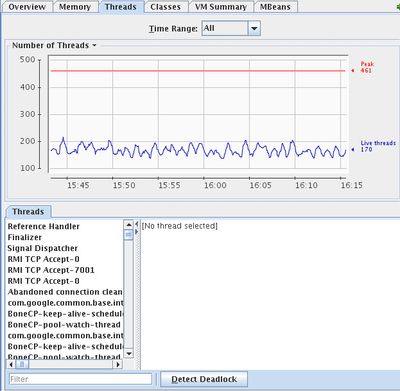
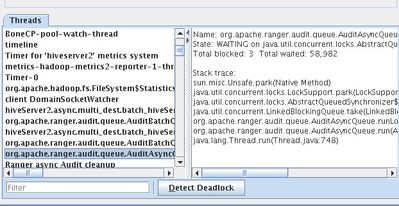
What can we infer about the kind of threads we see from jconsole
Number of threads have peaked to 461, currently only 170 are active
Abandoned connection cleaner is cleaning the lost connections.
Kafka- kerberos-refres-thread : As HS2 supports kerberos, TGT needs to be refreshed after the renewal period. It means we dont have to manually refresh the kerberos ticket.
HS2 is interacting with Kafka and Atlas as can be seen by the threads above
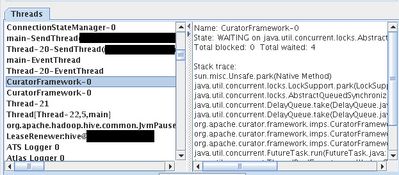
CuratorFramework is the class used for talking to zookeeper means HS2 is interacting with Zookeeper.
HS2 is interacting with SOLR and Hadoop services (RMI)
HS2 is sending audits to ranger, means HS2 is interacting with Ranger
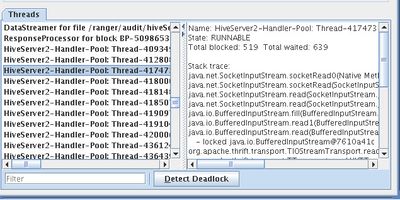
HS2 has some HiveServer2-Handler thread which are used for doing some reading from thrift Socket
(this is the thread used for responding to connection)
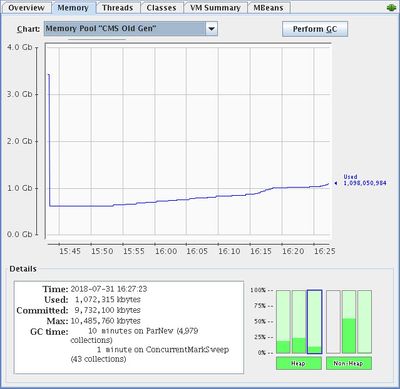
This view provides overall view of whats happening with the JVM.
GC : Old gen ParNew GC has been happening . and 10 mins have been spend on minor GC
ConcurrentMarkSweep is used for Tenured Gen and 1 min has been spend.
If you look VM summary (Total up-time of 3 days 3 hours) you can find when was the VM started and since then 10 mins has been spend on minor and 1
min on Major GC providing a good overview of how the process is tuned to handle GC and is the heap space sufficient.
Hence the above information provides the HS2 interaction with
1. Ranger
2. Solr
3. Kafka
4. Hadoop Components (NameNode, DataNode)
5. Kerberos
6. As its running Tez it should be interacting with Resource Manager and Node Manager
7. Heap and GC performance
Lets take a further deep dive of how exactly JVM is performing over time.
use jvisualm to find real time info of Threads and sampling of CPU and RAM
all the above mentioned information can be derived from command line too
1. find the pid of the process
ps -eaf | grep hiveserver2 (process name ) will fetch you the pid of the process
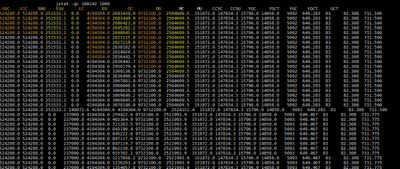
2. finding memory usage and gc at real time
Total Heap = EDEN SPACE (S0C + S1C + EC ) + Tenured Gen ( OC)
Currently Used Heap = EDEN SPACE (S0U + S1U + EU ) + Tenured Gen (OU)
YGC = 15769 says till now how many time young GC has been done
FGC = 83 How many times the FGC has been done
If you see the count increasing too frequently its time to optimize it .
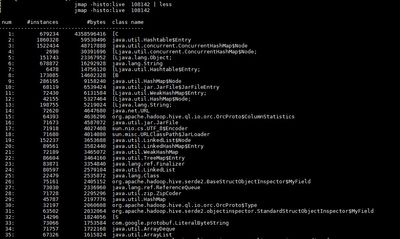
JMAP to find the instances available inside the class along with their count and memory footprint
Know state of threads running use jstack
top -p pid
RES = memory it consumes in RAM which should be equal to the heap consumed
Find ports on which the process is listening to and which all clients its is connected
To find any errors being reported by the service to client scan the network packets
tcpdump -D to find the interfaces the machine has
tcpdump -i network interface port 10000 -A (tcpdump -i eth0 port 10000 -A )
Scan the port 10000 on which HS2 is listening and look at the packets exchanged to find which client is having the exceptions
Any GSS exception or any other exception reported by Server to client can be seen in the packet.
To know the cpu consumption and memory consumed by the process top -p pid
To know the the disk I/O read write done by the process use iotop -p pid
Some OS commands to know about the how the host is doing running the process
1. iostat -c -x 3 dispaly the CPU and Disk IO
2. mpstat -A ALL get utilization of individual CPU
3. iostat -d -x 5 disk utilization
4. ifstat -t -i interface network utilization
Take away
1. Any exception you see in the process logs for clients can be tracked in the network packet, hence you dont need to enable debug logs ( use tcpdump )
2. A process consumes exceptionally high memory under High GC specially frequent FULL and minor GC
3. In hadoop every service client has a retry mechanism (no client fails after one retry) hence search for retries in the log and try to optimize for that
4. jconsole and jvisualm reveals all important info from threads, memory, cpu utilization, GC
5. keep a check on cpu, network, disk and memory utilization of the process to get holistic overview of the process.
6. In case of failure take heap dump and analyse using jhat for deeper debugging. Jhat will generally consume 6X the memory of the size of the dump (20 GB heap dump will need 120 GB of heap for jhat to run, jhat -J-mx20g hive_dump.hprof)
7. Always refer to the code to have a correlation of th process behavior to memory foot print.
8. jmap output will help you understand what data structure is consuming most of heap and you can point to where in the code the data Structure is being used. Jhat will help you get the tree of the data Structure.


