Community Articles
- Cloudera Community
- Support
- Community Articles
- How to create a custom Ambari Alert and use it for...
- Subscribe to RSS Feed
- Mark as New
- Mark as Read
- Bookmark
- Subscribe
- Printer Friendly Page
- Report Inappropriate Content
- Subscribe to RSS Feed
- Mark as New
- Mark as Read
- Bookmark
- Subscribe
- Printer Friendly Page
- Report Inappropriate Content
Objectives
Everyday Hortonworks customers are taking advantage of the flexibility and elasticity that cloud platforms provide. For many of these customers, Cloudbreak is used to manage their HDP clusters and to provide autoscaling capability.
Cloudbreak's autoscaling features are tied to Ambari Alerts. Ambari ships with a set of alerts out of the box. However, you may want to enable an autoscaling policy based on an alert that Ambari doesn't provide out of the box. The good news is Ambari supports creating custom alerts. Custom alerts created in Ambari are visible to Cloudbreak and usable with Cloudbreak autoscaling policies.
A common desire with autoscaling is to scale the cluster based on memory used, cores used, or perhaps the number of running applications. You can use the YARN ResourceManager JMX data to determine these values. For example, you may have a typical cluster with 5 Node Managers. You also know that sometimes your cluster usage will spike and you want to increase the number of Node Managers by 3, but you don't want to run 8 Node Managers all the time to save costs. You can create an alert based on the JMX data from YARN ResourceManager to scale the cluster based on usage. Then Cloudbreak can scale the cluster when the alert is triggered.
This tutorial will walk you through the process of creating a custom Ambari Alert for use by Cloudbreak autoscaling policies.
Prerequisites
- You should have a properly running instance of Cloudbreak with credentials for your cloud provider of choice.
- You should have an Ambari 2.5/HDP 2.6 cluster already deployed with Cloudbreak.
Scope
This tutorial was tested in the following environment:
- Cloudbreak 1.16.4
- AWS EC2
- Ambari 2.5
- HDP 2.6
Steps
Login into Ambari
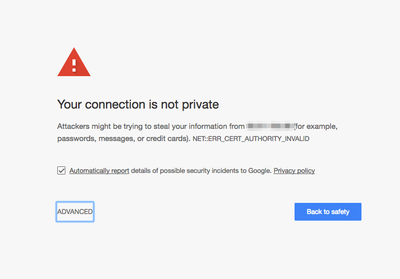
As mentioned in the prerequisites, you should already have a cluster built using Cloudbreak. Click on the cluster summary box in the Cloudbreak UI to display the cluster details. Now click on the link to your Ambari cluster. You may see something similar to this:
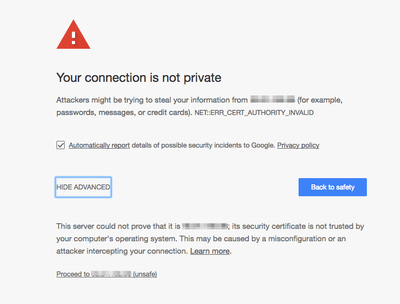
Your screen may vary depending on your browser of choice. I'm using Chrome. This warning is because Cloudbreak uses self-signed certificates which are not trusted. Click on the Advanced link. You should see something similar to this:
Click on the Proceed link to open the Ambari login screen. You should be able to login to Ambari using the default username and password of admin unless you changed it.
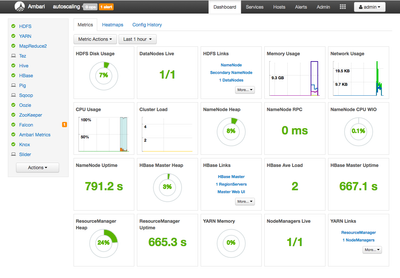
Once you have logged into Ambari, you should see something similar to this:
NOTE: Your specific cluster may look different.
Login into YARN ResourceManager
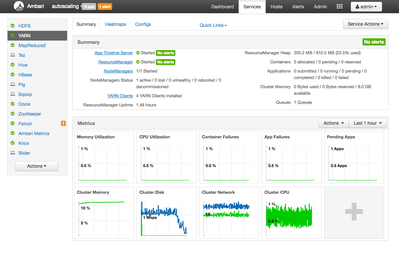
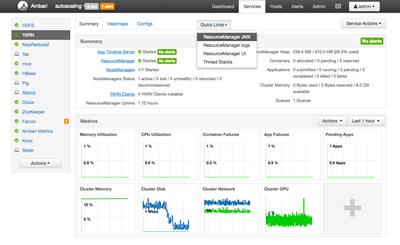
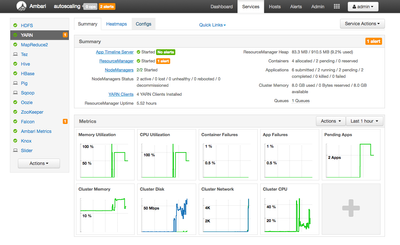
YARN is the central component used to manage resource availability on an HDP cluster. In Ambari, you can see a high-level summary of resources available to YARN to by click on the YARN link in the service list on the Ambari dashboard. You should see something similar to this:
If you take a look at the upper right corner, you can see a summary of containers, applications and cluster memory. For this tutorial, I would like Cloudbreak to autoscale my cluster when the number of pending applications is greater than 2. To do this, I'm going to create a custom Ambari Alert based on that value. To get that value, I need to look at the YARN ResourceManager JMX data.
View YARN ResourceManager JMX Data
You can view available JMX data for the YARN ResourceManager via the Ambari Quick Links. You should already have the YARN ResourceManager dashboard visible from the last step. Click on the Quick Links drop down menu in the top middle of the screen. You should see something similar to this:
As you can see, ResourceManager JMX is available in the list. If you click that link you will see something similar to this:
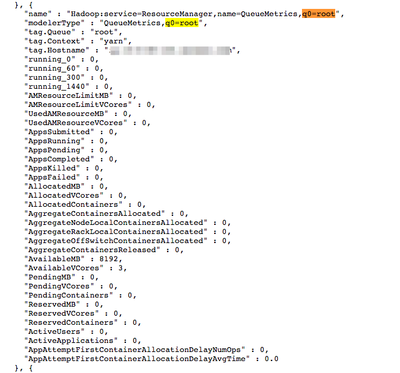
You should see a fairly large JSON output. If you search for q0=root, you should see something similar to this:
This is a list of YARN related metrics associated with the root queue. If you look in the list of values, you should see AppsPending. This is the metric I want to use for my Ambari Alert.
Review existing Alert definitions
You can view the definition for any Ambari provided Alerts.
To get a list of all alerts on the system, you make a call to the Ambari API:
curl -u admin:admin -i -k -H 'X-Requested-By:ambari' https://#.#.#.#/ambari/api/v1/clusters/autoscaling/alert_definitions/
You should see something similar to this:
HTTP/1.1 200 OK
Server: nginx
Date: Wed, 18 Oct 2017 17:15:21 GMT
Content-Type: text/plain
Content-Length: 21595
Connection: keep-alive
Vary: Accept-Encoding
X-Frame-Options: DENY
X-XSS-Protection: 1; mode=block
X-Content-Type-Options: nosniff
Cache-Control: no-store
Pragma: no-cache
Set-Cookie: AMBARISESSIONID=1gprc4wefyoiqmb1kj6plu95j;Path=/;HttpOnly
Expires: Thu, 01 Jan 1970 00:00:00 GMT
User: admin
Vary: Accept-Encoding, User-Agent
{
  "href" : "http://#.#.#.#/api/v1/clusters/autoscaling/alert_definitions/",
  "items" : [
    {
      "href" : "http://#.#.#.#/api/v1/clusters/autoscaling/alert_definitions/1",
      "AlertDefinition" : {
        "cluster_name" : "autoscaling",
        "id" : 1,
        "label" : "HBase Master Process",
        "name" : "hbase_master_process"
      }
    },
    ...
NOTE: Your username and password may be different. You need to update the curl call to use your IP address for the Ambari server and your cluster name. In this example, my cluster name is autoscaling. Also notice the use of https for Cloudbreak clusters and the need for the -k flag.
As you can see, each alert is assigned a unique id. To view the configuration of a specific alert, you make a curl call to the href link with the alert id provided in the output.
To see the definition of Alert id 1, make the following curl call:
curl -u admin:admin -i -k -H 'X-Requested-By:ambari' https://#.#.#.#/ambari/api/v1/clusters/autoscaling/alert_definitions/1
NOTE: With Cloudbreak, Ambari is using HTTPS and is proxied so change http to https and /api to /ambari/api.
You should see something similar to this:
HTTP/1.1 200 OK
Server: nginx
Date: Wed, 18 Oct 2017 17:24:00 GMT
Content-Type: text/plain
Content-Length: 1156
Connection: keep-alive
Vary: Accept-Encoding
X-Frame-Options: DENY
X-XSS-Protection: 1; mode=block
X-Content-Type-Options: nosniff
Cache-Control: no-store
Pragma: no-cache
Set-Cookie: AMBARISESSIONID=bcdh6wmyxpnd1ioufen9hikva;Path=/;HttpOnly
Expires: Thu, 01 Jan 1970 00:00:00 GMT
User: admin
Vary: Accept-Encoding, User-Agent
{
  "href" : "http://#.#.#.#/api/v1/clusters/autoscaling/alert_definitions/1",
  "AlertDefinition" : {
    "cluster_name" : "autoscaling",
    "component_name" : "HBASE_MASTER",
    "description" : "This alert is triggered if the HBase master processes cannot be confirmed to be up and listening on the network for the configured critical threshold, given in seconds.",
    "enabled" : true,
    "help_url" : null,
    "id" : 1,
    "ignore_host" : false,
    "interval" : 1,
    "label" : "HBase Master Process",
    "name" : "hbase_master_process",
    "repeat_tolerance" : 1,
    "repeat_tolerance_enabled" : false,
    "scope" : "ANY",
    "service_name" : "HBASE",
    "source" : {
      "default_port" : 60000.0,
      "reporting" : {
        "ok" : {
          "text" : "TCP OK - {0:.3f}s response on port {1}"
        },
        "warning" : {
          "text" : "TCP OK - {0:.3f}s response on port {1}",
          "value" : 1.5
        },
        "critical" : {
          "text" : "Connection failed: {0} to {1}:{2}",
          "value" : 5.0
        }
      },
      "type" : "PORT",
      "uri" : "{{hbase-site/hbase.master.port}}"
    }
  }
The alert definitions will vary depending on the component. My advice is to look for existing alert definitions around the component for which you are interested and use that as a base for your custom alerts.
Create Custom Alert JSON file
To submit a custom alert to Ambari, we can define the alert in a JSON file which we upload via the Ambari API. You can copy and paste the following alert definition to your alert file:
{
  "AlertDefinition" : {
      "cluster_name" : "autoscaling",
      "component_name" : "RESOURCEMANAGER",
      "description" : "This queue-level alert is triggered if the number of root queue pending applications exceeds 1.",
      "enabled" : true,
      "help_url" : null,
      "ignore_host" : false,
      "interval" : 5,
      "label" : "[CUSTOM] ResourceManager Pending Applications",
      "name" : "queue_pending_applications",
      "repeat_tolerance" : 1,
      "repeat_tolerance_enabled" : false,
      "scope" : "ANY",
      "service_name" : "YARN",
      "source" : {
        "jmx" : {
          "property_list" : ["Hadoop:service=ResourceManager,name=QueueMetrics,q0=root/AppsPending"],
          "value" : "{0}"
        },
        "reporting" : {
          "ok" : {
            "text" : "YARN Pending Applications: {0}"
          },
          "warning" : {
            "text" : "YARN Pending Applications: {0}",
            "value" : 2
          },
          "critical" : {
            "text" : "YARN Pending Applications: {0}",
            "value" : 3
          },
          "units" : "Applications"
        },
        "type" : "METRIC",
        "uri" : {
          "http" : "{{yarn-site/yarn.resourcemanager.webapp.address}}",
          "https" : "{{yarn-site/yarn.resourcemanager.webapp.https.address}}",
          "https_property" : "{{yarn-site/yarn.http.policy}}",
          "https_property_value" : "HTTPS_ONLY",
          "kerberos_keytab" : "{{yarn-site/yarn.resourcemanager.webapp.spnego-keytab-file}}",
          "kerberos_principal" : "{{yarn-site/yarn.resourcemanager.webapp.spnego-principal}}",
          "default_port" : 0.0,
          "connection_timeout" : 5.0,
          "high_availability" : {
            "alias_key" : "{{yarn-site/yarn.resourcemanager.ha.rm-ids}}",
            "http_pattern" : "{{yarn-site/yarn.resourcemanager.webapp.address.{{alias}}}}",
            "https_pattern" : "{{yarn-site/yarn.resourcemanager.webapp.https.address.{{alias}}}}"
          }
        }
      }
    }
}
You will need to change the value of cluster_name to match the name of your cluster. The label and name values can be customized by you, but they should be unique from other alerts in the system. The label is what will be displayed in the Ambari. I like to prepend [CUSTOM] on custom alerts to make it clear. Once you make the appropriate changes, you save the file as alert.json or really any filename you like.
This alert, as defined with throw a WARNING alert when the number of pending applications is 2 and a CRITICAL alert when the number of pending applications is 3.
Upload Custom Alert JSON file
Now that we have the custom alert file, we can submit it to the Ambari API to create the new alert. You submit the alert by using the following curl call:
curl -u admin:admin -i -k -H 'X-Requested-By:ambari' -X POST -d @alert.json https://#.#.#.#/ambari/api/v1/clusters/autoscaling/alert_definitions
You should see something similar to the following:
HTTP/1.1 100 Continue
HTTP/1.1 201 Created
Server: nginx
Date: Wed, 18 Oct 2017 17:52:47 GMT
Content-Type: text/plain
Content-Length: 0
Connection: keep-alive
X-Frame-Options: DENY
X-XSS-Protection: 1; mode=block
X-Content-Type-Options: nosniff
Cache-Control: no-store
Pragma: no-cache
Set-Cookie: AMBARISESSIONID=18utggom97x7z33z3d2x9h1mf;Path=/;HttpOnly
Expires: Thu, 01 Jan 1970 00:00:00 GMT
User: admin
Verify Custom Alert Exists
You can verify the alert exists using the API call we used before:
curl -u admin:admin -i -k -H 'X-Requested-By:ambari' https://#.#.#.#/ambari/api/v1/clusters/autoscaling/alert_definitions
You should see the new alert at the bottom of the list:
{
  "href" : "http://#.#.#.#/api/v1/clusters/autoscaling/alert_definitions/75",
  "AlertDefinition" : {
    "cluster_name" : "autoscaling",
    "id" : 75,
    "label" : "[CUSTOM] ResourceManager Pending Applications",
    "name" : "queue_pending_applications"
  }
}
]
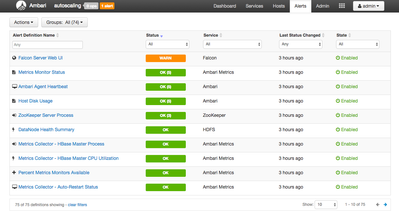
You can also verify via the Ambari Alerts page. In the upper right-hand menu of Ambari, click on Alerts. You should see something similar to this:
Now filter for CUSTOM and you should see something similar to this:
As you can see, the alert exists in Ambari. After a few minutes, the status should change from NONE to OK.
Create Cloudbreak Autoscaling Policy
Now that our custom alert exists in Ambari, we can create a Cloudbreak autoscaling policy based on that alert. In the Cloudbreak UI, show the details for the cluster you have running. You should see something similar to this:
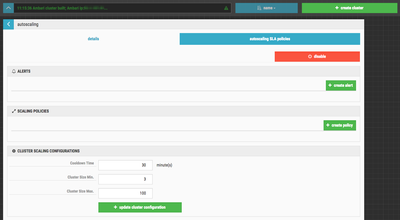
Click on the autoscaling SLA polices link to the right of details. You should see something similar to this:
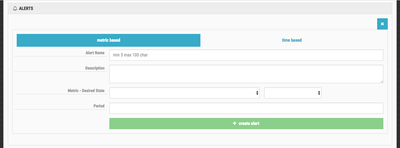
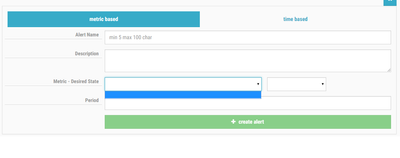
enable button to enable autoscaling. You should see something similar to this:Before creating the policy, you have to define the Ambari Alert on which you want to trigger. Click the create alert button. You should see something similar to this:
You have to option to chose between metric based and time based alerts. Time based alerts allow you to define a cron based time period where autoscaling events will happen. For this tutorial, I'm going to use metric based.
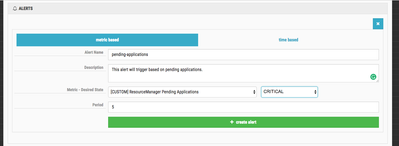
The Alert Name and Description are up to you. I recommend using something informative. The Metric - Desired State is a drop down where you select from the list of available Ambari Alerts and you determine which Alert state you want to trigger. The Period is how long, in minutes, the alert should exist before an autoscaling event is triggered. You should use a value that is reasonable; you don't want the scaling events happening too quickly as that can cause a lot of churn.
You can see what I've used as an example:
When you have everything entered, click on the create alert button. Now we can define the scaling policy itself. Click on the create policy button. You should see something similar to this:
The Policy Name is up to you. Again, I recommend using something informative. The Scaling Adjustment is how many nodes to add to the cluster. The dropdown to the right specifies the node metric. You can specify a specific node count, a percentage of nodes based on the cluster size, or a total cluster node count. The Host Group defines which kind of nodes should be added. This will go back to your Blueprint used to build the cluster. You may have compute or data only nodes that you want to add. The Alert is the Cloudbreak Alert we created in the previous step.
You can see what I used as an example:

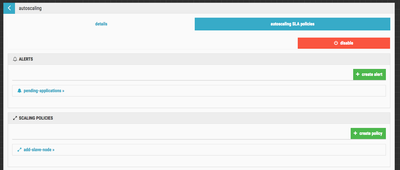
When you have everything entered, click on the create policy button. You should now have an Alert and Scaling Policy defined. You should see something similar to this:
Run Jobs On The Cluster
To trigger the alert, I'm going to run some jobs on my cluster. A simple test would be to run a couple of copies of TeraGen. Because of the size of my cluster, I shouldn't have the capacity to run more than 1 of those at a time. This should create pending applications which will trigger the alert.
To do this I'm going to log into one of the nodes in my cluster using ssh. You can do this using something similar to this:
ssh -i cloudbreak cloudbreak@#.#.#.#
NOTE: Your keyname and ip will be different.
You should see something similar to this:
The authenticity of host '#.#.#.# (#.#.#.#)' can't be established.
ECDSA key fingerprint is SHA256:C10UDnRxnTTaxkWqv5cPgw/FItKWvEdyWmeS2BKVUU8.
Are you sure you want to continue connecting (yes/no)? yes
Warning: Permanently added '#.#.#.#' (ECDSA) to the list of known hosts.
       __|  __|_  )
       _|  (     /   Amazon Linux AMI
      ___|\___|___|
https://aws.amazon.com/amazon-linux-ami/2017.03-release-notes/
27 package(s) needed for security, out of 61 available
Run "sudo yum update" to apply all updates.
Amazon Linux version 2017.09 is available.
I'm going to need 4 sessions because I want to have 4 submitted jobs at the same time. In each session I'm going to run the following command:
sudo -u hdfs hadoop jar /usr/hdp/current/hadoop-mapreduce-client/hadoop-mapreduce-examples.jar teragen 1000000000 /tmp/terasort1-input
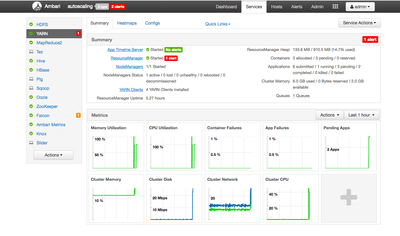
For each session you need to specify a unique output directory. In my case I used terastor1-input, terasort2-input, etc. We need enough jobs running for the alert to trigger and be present for at least 5 minutes, which is the time period we specified in Cloudbreak. In Ambari, click on YARN to see the summary dashboard. You should see something similar to this:
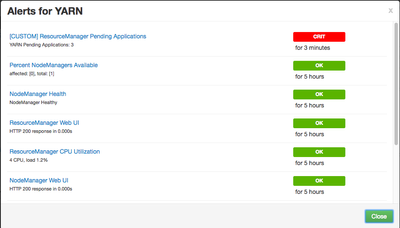
If you click on the red 1 alert you can get more details. You should see something similar to this:
As you can see, this has been CRIT for 3 minutes. Cloudbreak won't trigger an autoscale event until it has been 5 minutes. After 5 minutes has passed and the alert is still present, Cloudbreak should start autoscaling. IF you look at the HISTORY second on the Cluster autoscaling page, you should see something similar to this:
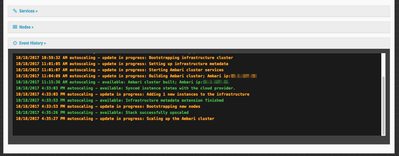
As you can see, Cloudbreak as started the autoscaling process. It will add 1 node to the cluster based on our policy. You can also see this on the cluster details page in the Event History. You should see something similar to this:
After a couple of minutes, you should notice Ambari showing the addition of another node in the list of operations. You should see something similar to this:
Once the new node is added you should notice that one of the other jobs is picked up and the Alert changes from CRITICAL to WARN. You should see something similar to this:
Next Steps
The autoscaling policy we setup only addresses the addition of new nodes. You need to consider multiple policies that adjusts the cluster up and down. For example you could have a policy that sets the cluster size to a specific total node count when an alert is OK.
Cloudbreak also allows you to adjust the scaling configuration to allow for a cool down time with min and max cluster size. This helps you to control the amount of cluster churn created by autoscaling events. Combined with adjusting the period for the Cloudbreak alert, you have a reasonable amount of control over autoscaling on the cluster.
Review
If you have successfully followed along with this tutorial, you should have been able to create a custom Ambari Alert, to create a Cloudbreak autoscaling policy based on that alert, then see the alert and Cloudbreak autoscaling trigger based on running multiple TeraGen jobs.
Created on 11-08-2017 09:33 AM - edited 08-17-2019 10:29 AM
- Mark as Read
- Mark as New
- Bookmark
- Permalink
- Report Inappropriate Content
@Michael Young, Nice article, i have followed the steps and trying to setup auto-scaling for a hadoop cluster. One issue i'm facing is that the ambari metrics are not getting listed while creating a alert. Any help would be appreciable.
Thanks!
