Our Community is getting an upgrade! To get everything ready for the relaunch, we’ll be placing the site in read-only mode starting September 21st.
We really appreciate your understanding while we get things set up behind the scenes. Catch up on all the exciting details about the move here.
Need help or have questions? Drop us a line at [email protected]

Community Articles

Find and share helpful community-sourced technical articles.
Announcements
Share your experience with Cloudera on G2 and get a $25 Amazon Gift card.
Hi, I'm CLEO! Something exciting is coming to the Community. Stay Tuned!

Labels (1)
avatar
Expert Contributor
Components required:
  • jconsole (UI required)
  • jmxterm (for Linux environment - CLI only)
  • Kafka client (java producer/consumer) exposing JMX 
  • Kafka Brokers exposing jmx
Steps to get the available metrics (mbeans) available in a Kafka consumer (Environment with a UI available):
  1. Add the following JVM properties to your java consumer:
    -Dcom.sun.management.jmxremote=true -Dcom.sun.management.jmxremote.port=9090 -Dcom.sun.management.jmxremote.authenticate=false -Dcom.sun.management.jmxremote.ssl=false
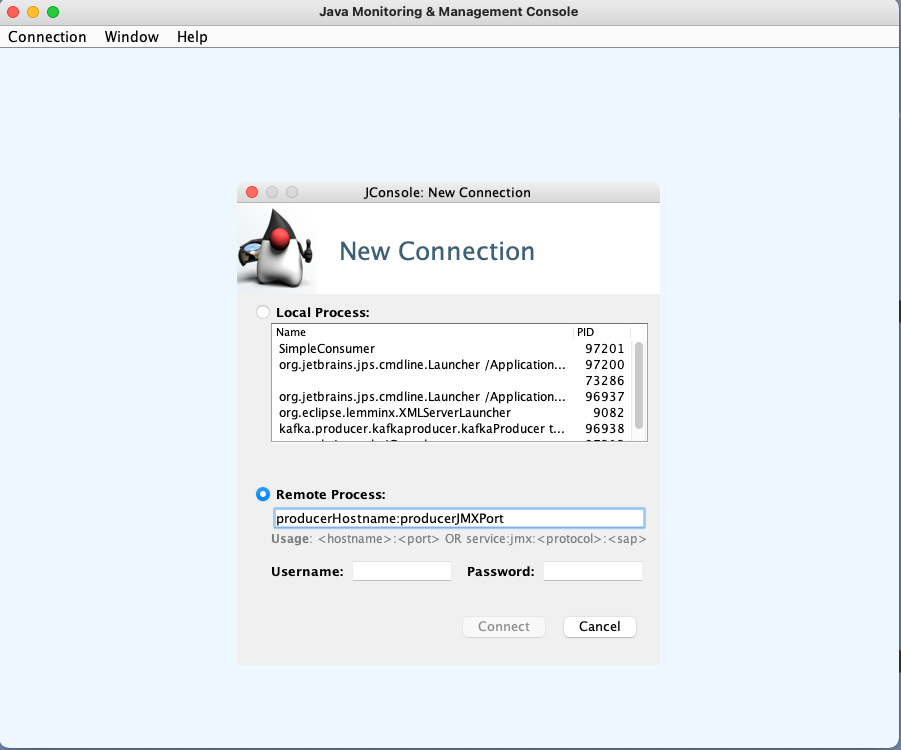
  2. After starting, your consumer uses jconsole to connect to the host:port specified in Step 1.Screen Shot 2021-11-29 at 18.21.02.png
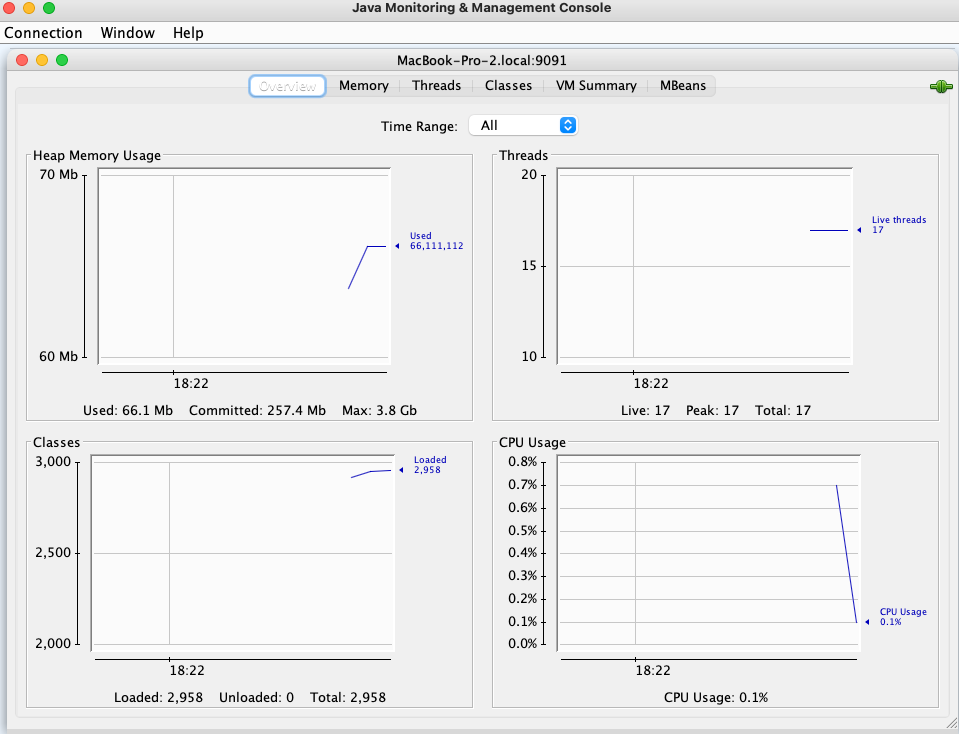
  3. After we add the <producer-hostname>:<JMXPort>, we should be able to see the following in the jconsole UI.Screen Shot 2021-11-29 at 18.22.46.png
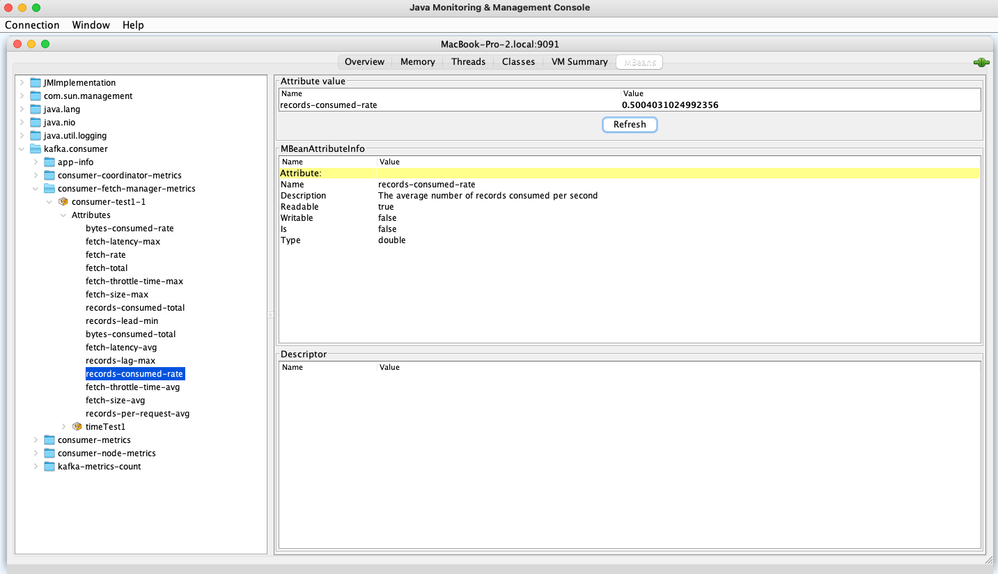
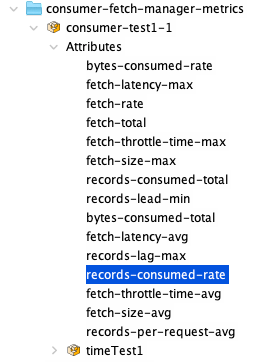
  4. Here, we have to click on the mbeans tab and navigate through the available metrics, in this example, we want to see the "records-consumer-rate" which in the program has the following definition "The average number of records consumed per second".Screen Shot 2021-11-29 at 18.25.12.pngIn this case, the average number of messages processed by this consumer is 0.5.
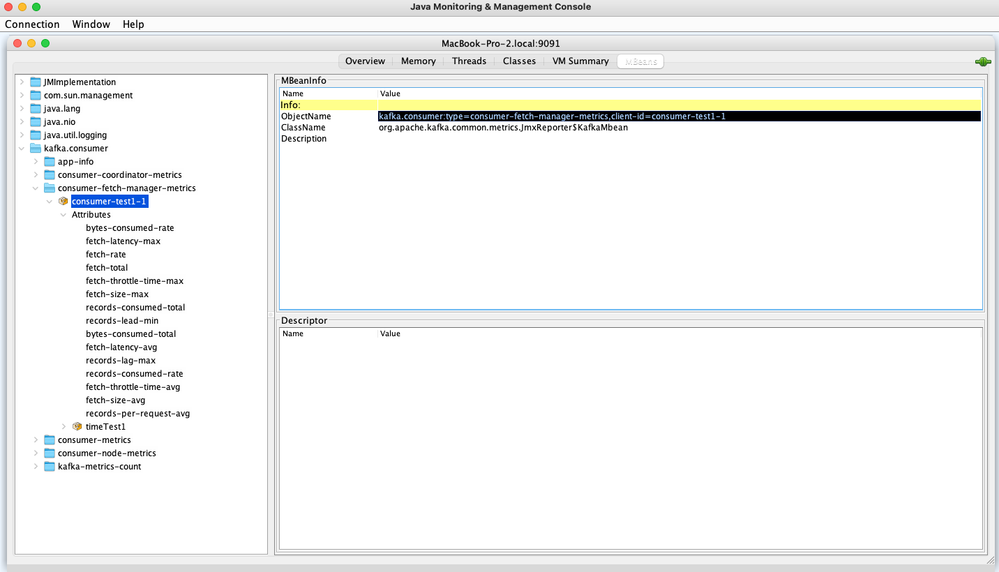
  5. If we want to pass this to a Kafka command line, we have to get the ObjectName from jconsole.Screen Shot 2021-11-29 at 18.27.21.png
  6. After that, run the following command line and replace the "objectName" accordingly. Example output:
    ./kafka-run-class.sh kafka.tools.JmxTool --jmx-url service:jmx:rmi:///jndi/rmi://clientHost:clientJMXPort/jmxrmi --object-name 'kafka.consumer:type=consumer-fetch-manager-metrics,client-id=consumer-test1-1'
    Trying to connect to JMX url: service:jmx:rmi:///jndi/rmi://clientHost:clientJMXPort/jmxrmi.
    "time","kafka.consumer:type=consumer-fetch-manager-metrics,client-id=consumer-test1-1:bytes-consumed-rate","kafka.consumer:type=consumer-fetch-manager-metrics,client-id=consumer-test1-1:bytes-consumed-total","kafka.consumer:type=consumer-fetch-manager-metrics,client-id=consumer-test1-1:fetch-latency-avg","kafka.consumer:type=consumer-fetch-manager-metrics,client-id=consumer-test1-1:fetch-latency-max","kafka.consumer:type=consumer-fetch-manager-metrics,client-id=consumer-test1-1:fetch-rate","kafka.consumer:type=consumer-fetch-manager-metrics,client-id=consumer-test1-1:fetch-size-avg","kafka.consumer:type=consumer-fetch-manager-metrics,client-id=consumer-test1-1:fetch-size-max","kafka.consumer:type=consumer-fetch-manager-metrics,client-id=consumer-test1-1:fetch-throttle-time-avg","kafka.consumer:type=consumer-fetch-manager-metrics,client-id=consumer-test1-1:fetch-throttle-time-max","kafka.consumer:type=consumer-fetch-manager-metrics,client-id=consumer-test1-1:fetch-total","kafka.consumer:type=consumer-fetch-manager-metrics,client-id=consumer-test1-1:records-consumed-rate","kafka.consumer:type=consumer-fetch-manager-metrics,client-id=consumer-test1-1:records-consumed-total","kafka.consumer:type=consumer-fetch-manager-metrics,client-id=consumer-test1-1:records-lag-max","kafka.consumer:type=consumer-fetch-manager-metrics,client-id=consumer-test1-1:records-lead-min","kafka.consumer:type=consumer-fetch-manager-metrics,client-id=consumer-test1-1:records-per-request-avg"
    1638221356007,9.076115605876556,12850.0,669.0075187969925,770.0,3.0063291139240507,18.0,18.0,0.0,0.0,1755.0,0.5042286447709198,720.0,0.0,2002.0,1.0
    1638221358013,9.072183021431389,12868.0,669.2446043165468,770.0,3.005860346430811,18.0,18.0,0.0,0.0,1761.0,0.5040101678572994,721.0,0.0,2002.0,1.0
    1638221360012,9.068771517339826,12886.0,669.951724137931,770.0,3.005492797181055,18.0,18.0,0.0,0.0,1767.0,0.5038206398522126,722.0,0.0,2002.0,1.0
    Each comma is separated by a different metric. If you count the number of metrics available in jconsole and you want to identify the "records-consumed-rate", just count the number of lines in jconsole, and then count the number of commas in the output, in this case, the records-consumed-rate is listed in the jconsole line 12:Screen Shot 2021-11-29 at 18.32.30.png
    Then taking one line from the terminal output we see that line 12 value is "0.5038206398522126":
    1638221360012,9.068771517339826,12886.0,669.951724137931,770.0,3.005492797181055,18.0,18.0,0.0,0.0,1767.0,0.5038206398522126,722.0,0.0,2002.0,1.0
    The above steps apply to a producer and brokers; we just have to identify the JMX port used by the service and make sure we have access to get the metrics.

    In the case we don't have a UI or access to the JMX ports from external hosts, jmxterm is a good alternative to list the mbeans available.

    See the steps to run jmxterm below:
    1. Download jmxterm from the official site.
    2. In the terminal (make sure the JMX port is available for your service); execute the following:
       java -jar jmxterm-1.0.2-uber.jar --url <kafkahost>:<kafkaJMXPort>
    3. If the connection is successful, we will see the following:
      Welcome to JMX terminal. Type "help" for available commands.
      $>
    4. Here we can list the mbeans available for the service that we are connected to, for example, trimmed for a broker host:
      $>beans
      ...
      ...
      #domain = kafka.controller:
      kafka.controller:name=ActiveControllerCount,type=KafkaController
      kafka.controller:name=AutoLeaderBalanceRateAndTimeMs,type=ControllerStats
      kafka.controller:name=ControlledShutdownRateAndTimeMs,type=ControllerStats
      kafka.controller:name=ControllerChangeRateAndTimeMs,type=ControllerStats
      kafka.controller:name=ControllerShutdownRateAndTimeMs,type=ControllerStats
      ...
      ...
    5. Then if we want to get the active controller metric, we can use:
      [root@brokerHost ~]# kafka-run-class kafka.tools.JmxTool --jmx-url service:jmx:rmi:///jndi/rmi://brokerHost:brokerJMXPort/jmxrmi --object-name 'kafka.controller:name=ActiveControllerCount,type=KafkaController'
      21/11/29 21:50:26 INFO utils.Log4jControllerRegistration$: Registered kafka:type=kafka.Log4jController MBean
      Trying to connect to JMX url: service:jmx:rmi:///jndi/rmi://brokerHost:brokerJMXPort/jmxrmi.
      "time","kafka.controller:type=KafkaController,name=ActiveControllerCount:Value"
      1638222626788,1
      1638222628783,1
      1638222630783,1


8,011 Views
Version history
Last update:
‎11-29-2021 08:32 PM
Updated by: