Community Articles
Find and share helpful community-sourced technical articles.
Turn on suggestions
Auto-suggest helps you quickly narrow down your search results by suggesting possible matches as you type.
- Cloudera Community
- Support
- Community Articles
- How to obtain the list of available metrics for Ka...
Options
- Subscribe to RSS Feed
- Mark as New
- Mark as Read
- Bookmark
- Subscribe
- Printer Friendly Page
- Report Inappropriate Content
Options
- Subscribe to RSS Feed
- Mark as New
- Mark as Read
- Bookmark
- Subscribe
- Printer Friendly Page
- Report Inappropriate Content
Expert Contributor
Created on
11-29-2021
08:22 PM
- edited on
11-29-2021
08:32 PM
by
subratadas
Components required:
- jconsole (UI required)
- jmxterm (for Linux environment - CLI only)
- Kafka client (java producer/consumer) exposing JMX
- Kafka Brokers exposing jmx
Steps to get the available metrics (mbeans) available in a Kafka consumer (Environment with a UI available):
- Add the following JVM properties to your java consumer:
-Dcom.sun.management.jmxremote=true -Dcom.sun.management.jmxremote.port=9090 -Dcom.sun.management.jmxremote.authenticate=false -Dcom.sun.management.jmxremote.ssl=false - After starting, your consumer uses jconsole to connect to the host:port specified in Step 1.
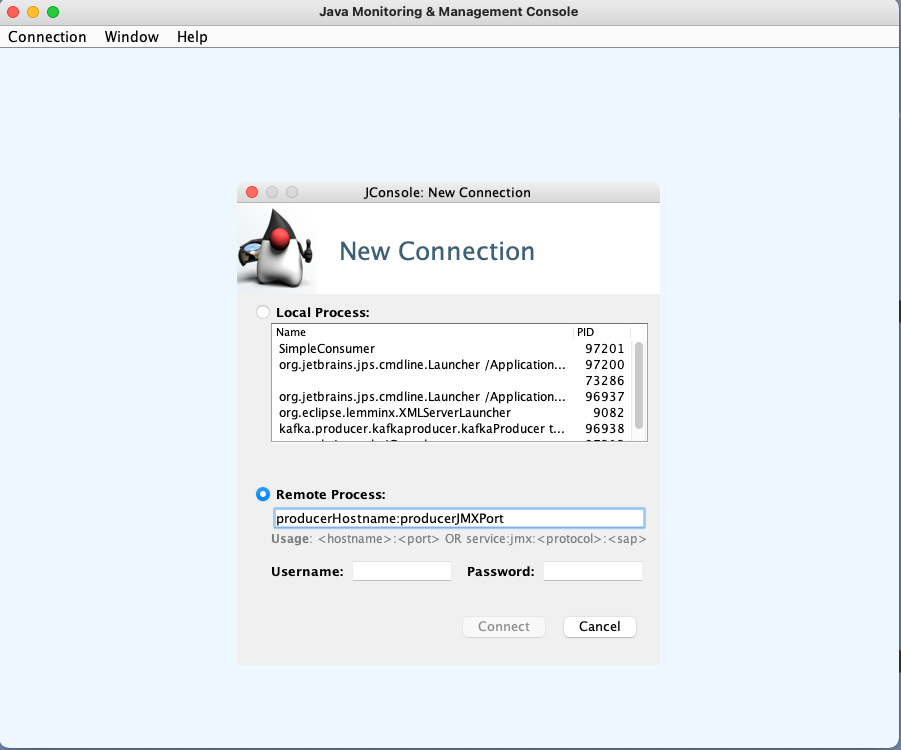
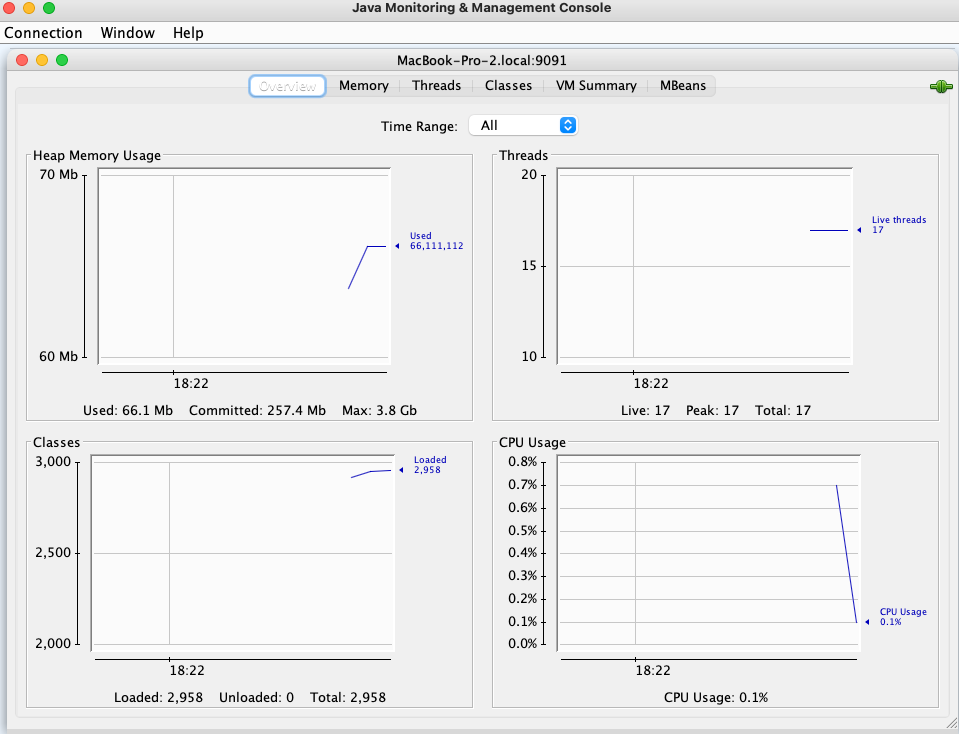
- After we add the <producer-hostname>:<JMXPort>, we should be able to see the following in the jconsole UI.
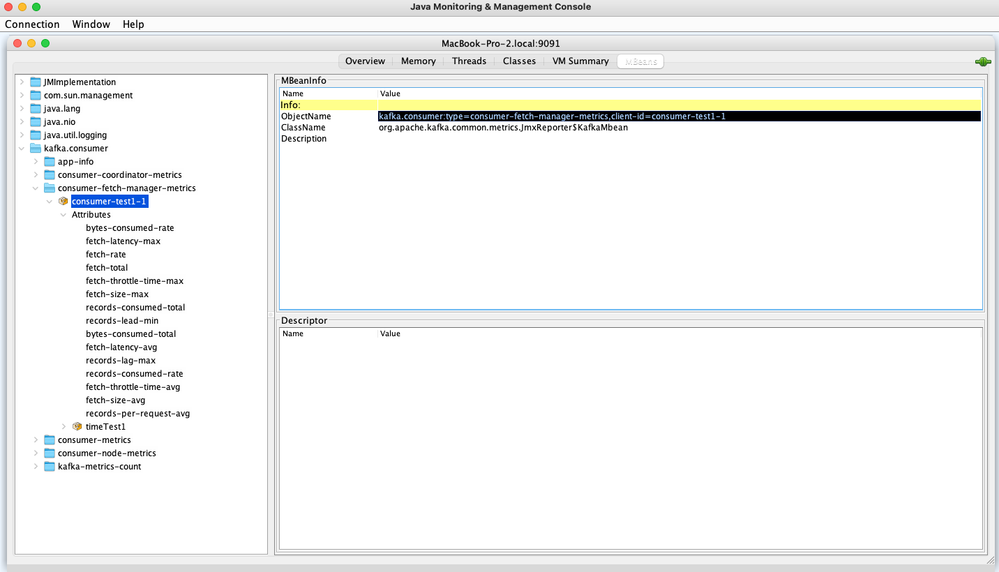
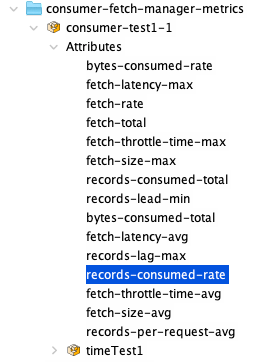
- Here, we have to click on the mbeans tab and navigate through the available metrics, in this example, we want to see the "records-consumer-rate" which in the program has the following definition "The average number of records consumed per second".
In this case, the average number of messages processed by this consumer is 0.5.
- If we want to pass this to a Kafka command line, we have to get the ObjectName from jconsole.
- After that, run the following command line and replace the "objectName" accordingly. Example output:
Each comma is separated by a different metric. If you count the number of metrics available in jconsole and you want to identify the "records-consumed-rate", just count the number of lines in jconsole, and then count the number of commas in the output, in this case, the records-consumed-rate is listed in the jconsole line 12:./kafka-run-class.sh kafka.tools.JmxTool --jmx-url service:jmx:rmi:///jndi/rmi://clientHost:clientJMXPort/jmxrmi --object-name 'kafka.consumer:type=consumer-fetch-manager-metrics,client-id=consumer-test1-1' Trying to connect to JMX url: service:jmx:rmi:///jndi/rmi://clientHost:clientJMXPort/jmxrmi. "time","kafka.consumer:type=consumer-fetch-manager-metrics,client-id=consumer-test1-1:bytes-consumed-rate","kafka.consumer:type=consumer-fetch-manager-metrics,client-id=consumer-test1-1:bytes-consumed-total","kafka.consumer:type=consumer-fetch-manager-metrics,client-id=consumer-test1-1:fetch-latency-avg","kafka.consumer:type=consumer-fetch-manager-metrics,client-id=consumer-test1-1:fetch-latency-max","kafka.consumer:type=consumer-fetch-manager-metrics,client-id=consumer-test1-1:fetch-rate","kafka.consumer:type=consumer-fetch-manager-metrics,client-id=consumer-test1-1:fetch-size-avg","kafka.consumer:type=consumer-fetch-manager-metrics,client-id=consumer-test1-1:fetch-size-max","kafka.consumer:type=consumer-fetch-manager-metrics,client-id=consumer-test1-1:fetch-throttle-time-avg","kafka.consumer:type=consumer-fetch-manager-metrics,client-id=consumer-test1-1:fetch-throttle-time-max","kafka.consumer:type=consumer-fetch-manager-metrics,client-id=consumer-test1-1:fetch-total","kafka.consumer:type=consumer-fetch-manager-metrics,client-id=consumer-test1-1:records-consumed-rate","kafka.consumer:type=consumer-fetch-manager-metrics,client-id=consumer-test1-1:records-consumed-total","kafka.consumer:type=consumer-fetch-manager-metrics,client-id=consumer-test1-1:records-lag-max","kafka.consumer:type=consumer-fetch-manager-metrics,client-id=consumer-test1-1:records-lead-min","kafka.consumer:type=consumer-fetch-manager-metrics,client-id=consumer-test1-1:records-per-request-avg" 1638221356007,9.076115605876556,12850.0,669.0075187969925,770.0,3.0063291139240507,18.0,18.0,0.0,0.0,1755.0,0.5042286447709198,720.0,0.0,2002.0,1.0 1638221358013,9.072183021431389,12868.0,669.2446043165468,770.0,3.005860346430811,18.0,18.0,0.0,0.0,1761.0,0.5040101678572994,721.0,0.0,2002.0,1.0 1638221360012,9.068771517339826,12886.0,669.951724137931,770.0,3.005492797181055,18.0,18.0,0.0,0.0,1767.0,0.5038206398522126,722.0,0.0,2002.0,1.0
Then taking one line from the terminal output we see that line 12 value is "0.5038206398522126":
The above steps apply to a producer and brokers; we just have to identify the JMX port used by the service and make sure we have access to get the metrics.1638221360012,9.068771517339826,12886.0,669.951724137931,770.0,3.005492797181055,18.0,18.0,0.0,0.0,1767.0,0.5038206398522126,722.0,0.0,2002.0,1.0
In the case we don't have a UI or access to the JMX ports from external hosts, jmxterm is a good alternative to list the mbeans available.
See the steps to run jmxterm below:- Download jmxterm from the official site.
- In the terminal (make sure the JMX port is available for your service); execute the following:
java -jar jmxterm-1.0.2-uber.jar --url <kafkahost>:<kafkaJMXPort> - If the connection is successful, we will see the following:
Welcome to JMX terminal. Type "help" for available commands. $> - Here we can list the mbeans available for the service that we are connected to, for example, trimmed for a broker host:
$>beans ... ... #domain = kafka.controller: kafka.controller:name=ActiveControllerCount,type=KafkaController kafka.controller:name=AutoLeaderBalanceRateAndTimeMs,type=ControllerStats kafka.controller:name=ControlledShutdownRateAndTimeMs,type=ControllerStats kafka.controller:name=ControllerChangeRateAndTimeMs,type=ControllerStats kafka.controller:name=ControllerShutdownRateAndTimeMs,type=ControllerStats ... ... - Then if we want to get the active controller metric, we can use:
[root@brokerHost ~]# kafka-run-class kafka.tools.JmxTool --jmx-url service:jmx:rmi:///jndi/rmi://brokerHost:brokerJMXPort/jmxrmi --object-name 'kafka.controller:name=ActiveControllerCount,type=KafkaController'
21/11/29 21:50:26 INFO utils.Log4jControllerRegistration$: Registered kafka:type=kafka.Log4jController MBean
Trying to connect to JMX url: service:jmx:rmi:///jndi/rmi://brokerHost:brokerJMXPort/jmxrmi.
"time","kafka.controller:type=KafkaController,name=ActiveControllerCount:Value"
1638222626788,1
1638222628783,1
1638222630783,1
7,424 Views


