Community Articles
- Cloudera Community
- Support
- Community Articles
- Introduction to Application Timeline Server
- Subscribe to RSS Feed
- Mark as New
- Mark as Read
- Bookmark
- Subscribe
- Printer Friendly Page
- Report Inappropriate Content
- Subscribe to RSS Feed
- Mark as New
- Mark as Read
- Bookmark
- Subscribe
- Printer Friendly Page
- Report Inappropriate Content
Created on 12-20-2019 09:26 AM
Introduction to Application Timeline Server
All the metrics of applications, either current or historic, can be retrieved from Yarn through Application Timeline Server. This will include pieces of information like the number of map tasks, reduce tasks, counters, etc. Application developers can publish the specific information to the Timeline server via TimelineClient in the Application Master and/or the application’s containers. The information is then queryable via REST APIs. The above said are the artifacts of the present application.
Also, generic information of completed applications like queue-name, user information a list of application-attempts that ran for an application, information about each application-attempt can be stored in the Application Timeline Server.
Let us delve into a live example of an Application Server. We are using HDP 3.1 cluster in this example.
Note: The following is for Hadoop Version:
The following is a demonstration of Time Service and Timeline Service reader from Ambari UI:
It should be noted that the Timeline Server and Timeline Reader exists as a different process in the cluster, and it may or may not be collocated. The following is the output of ps -ef | grep ‘timeline server’ from the machine in which Timeline Server is installed:
Timeline Server
In the example demonstrated in this document, we are restricting ourselves to an embedded HBASE storage. (Note: Other storage options like standalone HBase or external HBase storage options are beyond the scope of this document).

Process capture of Embedded HBase
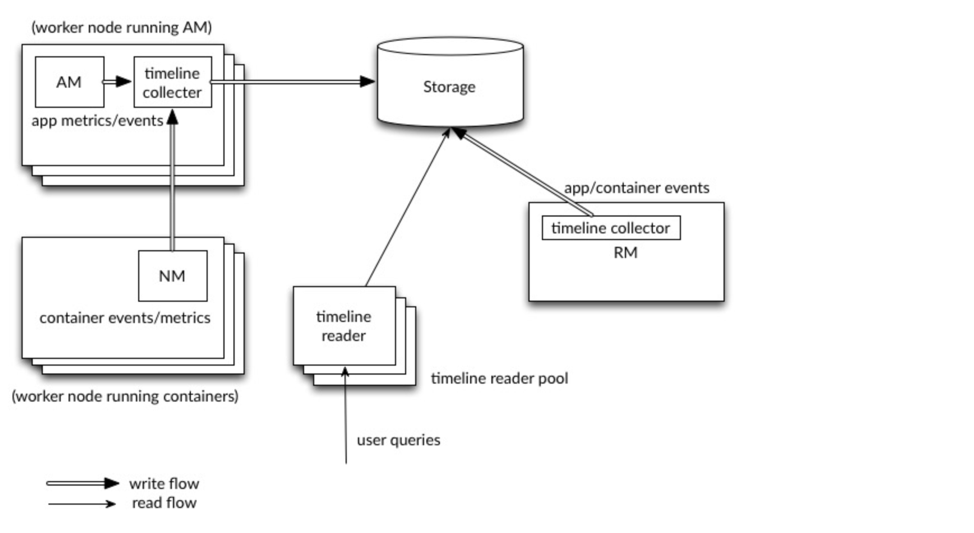
Flow Chart of Metrics Collection to Storage(Hbase)
(Image Source: Publishing_application_specific_data)
Demystifying the Flow Chart of Metrics Flow
The general concept is that the application submission client submits an application to the Resource Manager via Yarn Client Object to request needful resources for its usage. The Resource Manager(RM) will launch the Application Master on an allocated container. From this point onwards Application Master (AM) becomes the actual owner of the job. The AM communicates with YARN cluster and handles application execution. During the application launch time, the main tasks of the AM include communicating with the RM to negotiate and allocate resources for future containers, and after container allocation, communicating YARN Node Managers (NMs) to launch application containers on them.
- Metrics Flow from Resource Manager (RM) to Storage: The resource manager has its dedicated in-process collector. The application related metrics like how many containers are used in a certain application, how many attempts for a job, queue details and scheduler statistics will be written to the Storage using in-process timeline collector.
- Application Master(AM), has its metrics flow action, which is similar to RM. For example, an application or AM is running on a certain Node Manager. The application-specific container-related metrics will be written by the timeline collector to the storage. Every AM has its exclusive Timeline collector which will collocate in the same hosts as the AM.
- Node Manager(NM) workflow action is unique. The collectors (writers) are currently embedded in the node managers as auxiliary services. Node Manager containers like, how much resources are allocated per container, resources being used by the container, when the containers are allocated for that application, when the containers are released from that corresponding application would be generated. These artifacts are written by the embedded timeline collector to the storage.
Created on 02-27-2020 10:35 AM
- Mark as Read
- Mark as New
- Bookmark
- Permalink
- Report Inappropriate Content
This is very good information. Where can I look for more documentation like this regarding specifically the modes other then "embedded"?
Thank you in advance,
David


