Community Articles
- Cloudera Community
- Support
- Community Articles
- Kafka Topics and Brokers Metrics with Ambari 2.2.2
- Subscribe to RSS Feed
- Mark as New
- Mark as Read
- Bookmark
- Subscribe
- Printer Friendly Page
- Report Inappropriate Content
- Subscribe to RSS Feed
- Mark as New
- Mark as Read
- Bookmark
- Subscribe
- Printer Friendly Page
- Report Inappropriate Content
Created on 06-01-2016 01:47 AM - edited 08-17-2019 12:12 PM
Introduction
Ambari 2.2.2 provides a better understanding of cluster health and performance metrics through advanced visualizations and pre-built dashboards, isolating critical metrics for core cluster services such as Kafka reducing time to troubleshoot problems, and improving the level of service for cluster tenants.
Ambari Metrics System (AMS) has also a new API to discover metrics. Only HDFS, YARN and HBASE default dashboards are included along with System metrics. Ambari 2.2.2 comes with built-in Grafana integration. Kafka default Grafana dashboard is targeted for Ambari 2.4. Until then, you can build a custom dashboard to see over 30 Kafka BrokerTopicMetrics using Grafana.
Tutorial
1. Install Ambari 2.2.2 or Upgrade to Ambari 2.2.2. On upgrade, to enable Grafana, follow instructions from Upgrade to Ambari 2.2.2.
2. Automated Install of HDP 2.4 with Ambari 2.2.2, including Kafka 0.9.0.2.4. Grafana is added automatically on a new install.
3. Explore Ambari Kafka Metrics that can be accessed as: http://<ams-host>:6188/ws/v1/timeline/metrics/metadata/
4. Add Grafana to Ambari Metrics.
5. Access Grafana to see out-of-box dashboards. Port 3000 is the default for Grafana UI. This is view-only. Built-in Grafana does not allow creation of new dashboards.
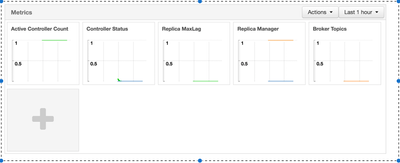
6. A few Kafka metrics are displayed by default, however, to see more Kafka metrics, click on Kafka link on the left nav, then click the big "+" sign to add a new widget for one or many metrics.
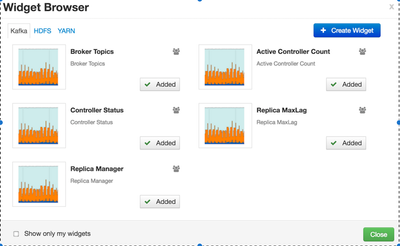
Select a widget from Widget Browser window:
Click on "Create Widget", select a widget type, let's say "Graph", "Add Metric" Kafka/ All Kafka Brokers, add a metric, for example kafka.server.BrokerTopicMetrics.BytestInPerSec.1MinuteRate and select the aggregation type. Follow screen instructions and save. The new widget will be added to Kafka metrics dashboard. Repeat the steps for all Kafka Broker Topic Metrics, as necessary. Unfortunately, you can't add a widget for a specific topic or a specific broker, at least not yet.
7. To create a custom dashboard adding desired Kafka topic & broker metrics, a separate Grafana installation is needed. This could be on your development machine. Follow instructions to build a custom dashboard. After complete, deploy on the server.
Conclusion
Ambari 2.2.2 metrics dashboard can provide a reasonable insight on all brokers metrics. Combined with Burrow and the promise for more Kafka metrics in the next versions of Ambari, the near future seems promising for Kafka monitoring.
Created on 06-02-2016 09:47 AM
- Mark as Read
- Mark as New
- Bookmark
- Permalink
- Report Inappropriate Content
Thank you for this great guide!
Created on 06-07-2016 07:34 PM
- Mark as Read
- Mark as New
- Bookmark
- Permalink
- Report Inappropriate Content
@Constantin Stanca Thanks for the Post. Is there a way we can use REST API call to retrieve the metrics (eg - Active controller count or Broker Topics etc... )
Created on 06-07-2016 09:05 PM
- Mark as Read
- Mark as New
- Bookmark
- Permalink
- Report Inappropriate Content
Never mind. I was able to figure this. Thanks.
Created on 06-20-2017 04:59 AM
- Mark as Read
- Mark as New
- Bookmark
- Permalink
- Report Inappropriate Content
Hi,
Is there any steps to take our own kafka server metrics to elasticsearch..because we have grafana which will have all the dashboards but some of our project requirement need to keep few kafka metrics in kibana visualization.so we want to index the kafka metrics logs to elasticsearch.
Can we consume kafka metrics into elasticsearch ?


