Community Articles
- Cloudera Community
- Support
- Community Articles
- LLAP debugging overview - logs, UIs, etc
- Subscribe to RSS Feed
- Mark as New
- Mark as Read
- Bookmark
- Subscribe
- Printer Friendly Page
- Report Inappropriate Content
- Subscribe to RSS Feed
- Mark as New
- Mark as Read
- Bookmark
- Subscribe
- Printer Friendly Page
- Report Inappropriate Content
Created on 12-01-2017 10:42 PM - edited 08-17-2019 09:55 AM
This article provides an overview of various debugging aspects of the system when using LLAP - how are things run, where logs are located, what monitoring options are available, etc. See the parent article for architecture overview and specific issue resolution.
HS2 when using LLAP
When using LLAP (“Hive interactive”), Ambari starts a separate HS2 (HS2 Interactive). This HS2 is not connected to the other HS2, and has a separate connection string, machine (or ports), configuration and logs .
HS2 interactive and LLAP configs in Ambari are split similarly to regular Hive configs, but have “-interactive-“ in their name.
HS2 interactive logs are called “hiveServer2Interactive” and are separate from regular HS2 logs.
YARN apps when using LLAP; getting query logs
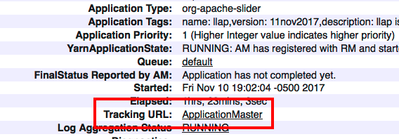
Ambari starts LLAP as a YARN app that is shared by everyone using the cluster. It should have N+1 containers, where N is the number of LLAP daemons, and there’s slider AM. LLAP YARN app is called “llap0” by default:
Tez session YARN apps will always have one container (the query coordinator) when LLAP is used.
In the below screenshot, LLAP cluster app and 2 single-container Tez sessions can be seen (this would be the case if 2 concurrent queries were configured in Ambari, see Cluster sizing).
Because of the YARN deployment model, LLAP does not use jars/configs/etc. on local machine.They are packaged by Ambari at LLAP startup time, and are deployed in the container directories of the LLAP YARN app. In 2.6, the package with the jars and configs is rebuilt on every LLAP restart.
Logs
LLAP YARN app contains task logs for all the queries ; each LLAP writes a separate log file for every query. The name format of the log file containing the task logs for a single query on a single daemonis " <hive query Id>-<DAG name>.log(.done)", e.g. hive_20171110190337_9cd58b54-62e0-4940-b0b8-e8b62f877cbb-dag_1505982789269_1038_1.log.Every daemon would have one log file for each (or almost every) query. Over time, the log files for completed queries (with .done extension) are picked up by YARN log aggregation and removed from daemons' YARN directories.
DAG name in the log file name corresponds to a Tez session app – e.g. in the above case, dag_1505982789269_ 1038_1 corresponds to query #1 in session represented by application_1505982789269_1038.This latter app (which is separate from the LLAP app) is the query coordinator (Tez AM) for the query and contains the Tez AM logs for it.
Slider commands and views; LLAP app status overview
Ambari uses Slider to launch LLAP. When debugging, it’s possible to use slider commands to affect the app without involving Ambari, e.g. “slider stop <name>” to stop the LLAP app by name (slider stop llap0). See “slider help” for more commands.
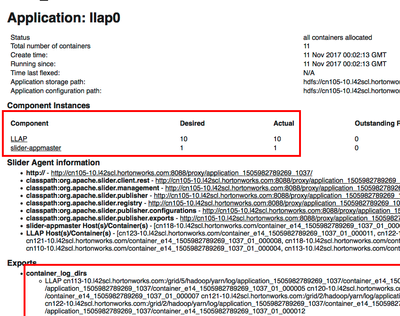
Slider AM also exposes a status view, accessed from the YARN application page:
The status view shows allocated and running containers, slider debugging info and also container logging directories on each machine, that can be used for manual debugging if there’s a problem with “yarn logs” command:
LLAP daemon status and metrics
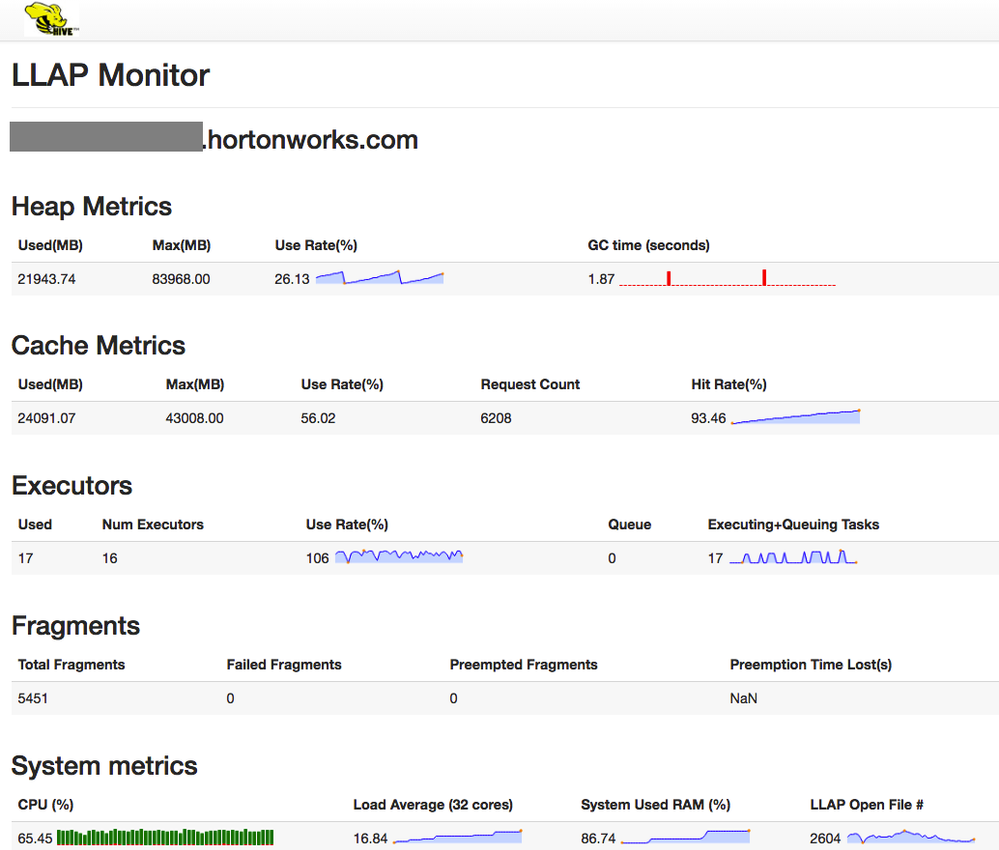
On each machine where LLAP is running, it exposes a number of endpoints on port 15002 (by default), i.e. http://(machine name):15002/ The default view shows some metrics; other useful views are:
- /jmx – shows various useful metrics, discussed below
- /stacks - shows daemon stacks – threads that process query fragments are TezTR-*and IO-Elevator-Thread*
- /conf – shows LLAP configuration (the values actually in use)
- /iomem (only in 3.0) – shows debug information about cache contents and usage
- /peers – shows all LLAP nodes in the cluster
- /conflog (only in 3.0) – allows one to see and add/change logger and log level for this daemon without restart
LLAP daemon metrics (JMX)
At <host>:15002/jmx, one can see a lot of LLAP daemon metrics. Things to pay attention to:
- ExecutorsStatus contains the information about tasks queued and executing on LLAP. This is the most useful section when debugging stuck queries to see which tasks are running and in queue.
- ExecutorMemoryPerInstance, IoMemoryPerInstance, MaxJvmMemory contain the memory configuration in use (see the sizing section).
- java.class.path is the LLAP daemon classpath; for debugging class-loading issues.
- llap.daemon.log.dir is the LLAP daemon logging directory.
- LastGcInfo contains the information about last GC (more is available in the GC log in the logging directory).
- LlapDaemonIOMetrics, LlapDaemonCacheMetrics, LlapDaemonExecutorMetrics, LlapDaemonJvmMetrics contain LLAP performance metrics. The latter is especially useful when debugging limit issues.
Tez view and performance debugging
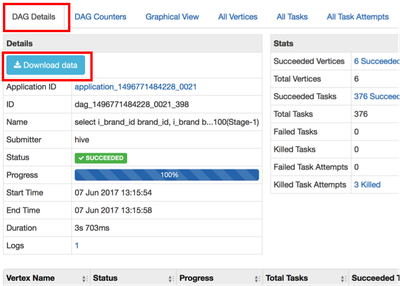
Tez view can be used to view Hive queries with LLAP, like the regular Hive queries; it has tabs with DAG representation, vertex swimlanes, etc. for each query.
In particular, one can download debugging and performance data for the query.
Grafana views
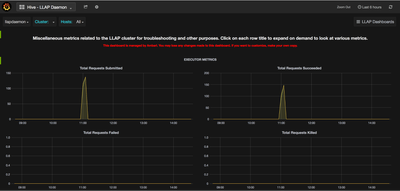
LLAP exposes metrics to Ambari Timeline Server which can be viewed via Grafana Dashboards. Grafana dashboards can be viewed from Ambari via Hive -> Quick Links -> Hive Dashboard (Grafana) . This should open up Grafana dashboard for all HDP components. Click on “Home” dropdown to navigate to any of the 3 LLAP dashboards
LLAP Daemon Dashboard snapshot that showing host level LLAP executor metrics.
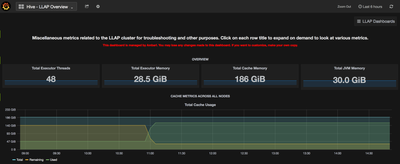
LLAP Overview Dashboard snapshot showing aggregated overview of memory from all nodes of LLAP cluster.
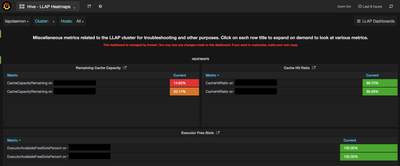
LLAP Heatmaps Dashboard snapshot showing host level cache and executor heatmaps.
There are several other metrics exposed via Grafana that can be useful for debugging. Full list of metrics and their description are available here https://docs.hortonworks.com/HDPDocuments/Ambari-2.6.0.0/bk_ambari-operations/content/grafana_hive_l...



Created on 12-05-2017 03:07 PM
- Mark as Read
- Mark as New
- Bookmark
- Permalink
- Report Inappropriate Content
Can you confirm the LLAP Monitor /iomem endpoint? I am getting a 404 on HDP 2.6.1 (hive-llap 2.1).
Created on 12-05-2017 07:15 PM
- Mark as Read
- Mark as New
- Bookmark
- Permalink
- Report Inappropriate Content
Sorry, I need to update it; that is also only available in 3.0


