Community Articles
- Cloudera Community
- Support
- Community Articles
- Monitor Hadoop JVMs with jVisualVM
- Subscribe to RSS Feed
- Mark as New
- Mark as Read
- Bookmark
- Subscribe
- Printer Friendly Page
- Report Inappropriate Content
- Subscribe to RSS Feed
- Mark as New
- Mark as Read
- Bookmark
- Subscribe
- Printer Friendly Page
- Report Inappropriate Content
Created on 05-21-2016 01:34 AM - edited 08-17-2019 12:22 PM
The goal of this article is to provide you step by step instruction to install jVisualVM to monitor JVMs inside your hadoop environment. Consult your operations team prior to making any production changes
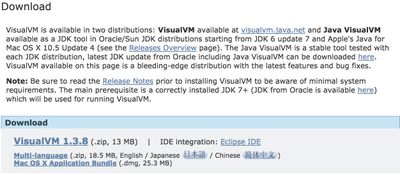
Go here to download jVisualVM - tool to visually monitor JVM in hadoop. HBase is a great example where you want to visually analyze JVM health. You may already have this tool on your workstation. Simple go to command line and type jVisualVM. If it comes up your in business. else download it:
Once you have application up and running install the Visual GC plugin. Tools ->available plugins->Visual GC
Lets go to the node you want to monitor. For jVisualVM to work it needs jstatd to run on the node. Once jstatd is running it automatically sends updates of remote applications running on the node to jVisualVM.
Run jstatd from command line.
If you get the following error:
We need to perform an additional simple configuration. Do the following steps
Run which jstatd then cd into the bin location
Create a policy file jstatd.all.policy in the bin directory (same location as jstatd). We are building a policy to allow jstatd to have permission to everything.
Inside the file add the following:
grant codebase "file:${java.home}/../lib/tools.jar" {
permission java.security.AllPermission;
};
Now run following command to start jstatd with your policy:
./jstatd -J-Djava.security.policy=jstatd.all.policy &
End of steps for jstatd error
Test if jstatd is running by issuing this command:
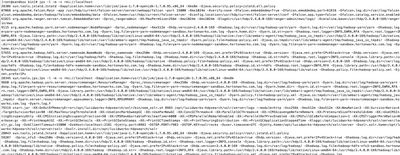
jps -l -m -v rmi://localhost
You will see tons of output such as:
Which looks good
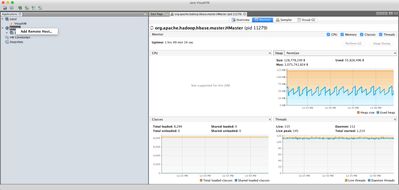
Open jvisualVM (command line type jVisualVM)
Right click on remote and select add remote host
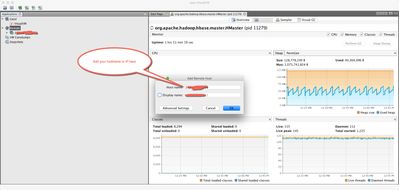
Add hostname or IP address of node you want to analyze:
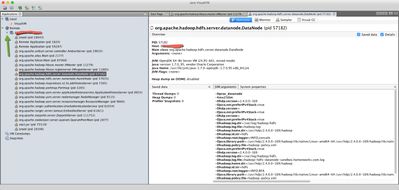
Now you are connected. Click on arrow next to your remote. This will display all JVMs running on the node:
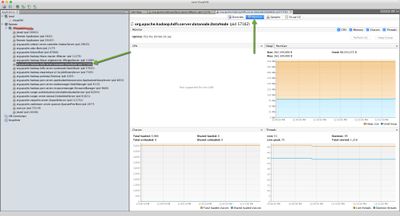
Now you can start analyzing. lets click on hbase data node and click on monitor tab:
Click on Visual GC tab to analyze different generations inside the JVM.
I hope this article helps you start analyzing at a deeper level JVMs on hadoop especially with hbase.

Created on 05-24-2016 03:19 PM
- Mark as Read
- Mark as New
- Bookmark
- Permalink
- Report Inappropriate Content
In production, for remote access, you would have to deal with firewall issues, however, for special cases when high severity issues troubleshooting is needed, Ops folks may agree to perform the needed changes. Additionally, you need to start the JVM with something like this in order to be able to truly access the JVM remotely (from a different host): -Djava.rmi.server.hostname = host ip , which forces RMI service to use the host ip instead of 127.0.0.1. By the nature of the Hadoop beast, most of the tools in the ecosystem would have multiple JVMs and some of them would be volatile, just to perform a task. Getting a lot of value of jvisualvm could be quite difficult, but it might prove useful in some boundary scenarios.
Created on 05-24-2016 03:51 PM
- Mark as Read
- Mark as New
- Bookmark
- Permalink
- Report Inappropriate Content
@Constantin Stanca This is standard for hbase development. If you can't see what your JVM is doing your driving blind. tuning the flushes for the memstore and blockcache are vital for performance. Testing GC for G1 vs CMS on namenode or hbase is vital for performance. For production remote access yes you always need clearance. Monitoring JVM during development is highly useful for namenode and hbase.
Created on 05-24-2016 03:53 PM
- Mark as Read
- Mark as New
- Bookmark
- Permalink
- Report Inappropriate Content
@Constantin Stanca what do you mean by "Additionally, you need to start the JVM with something like this in order to be able to truly access the JVM remotely"? JVM start as they normally do to use this tool.
