Our Community is getting an upgrade! To get everything ready for the relaunch, we’ll be placing the site in read-only mode starting September 21st. We really appreciate your understanding while we get things set up behind the scenes. Catch up on all the exciting details about the move here. Need help or have questions? Drop us a line at [email protected]
Created on 12-10-201608:55 AM - edited 08-17-201907:32 AM
This has been observed for Ambari 1.7. I know Ambari 1.7 is very old now however if some people are still using it and facing same issue then this post can save your lot of time! 🙂
.
We know that Ambari 1.7 has Ganglia for reporting metrics.
.
Our issue was, we were unable to get service metrics for YARN service, below was the exact scenario:
1. In Ganglia UI, I was able to get graphs for the YARN Metrics.
2. In Ambari UI, I was able to see metrics for other services like HDFS etc.
3. This issue was observed on one of our customer's cluster.
4. I did setup same cluster on my local system however I was not able to reproduce this issue.
5. Only difference in customer's and my cluster was, customer was having RM HA and I had installed single node instance.
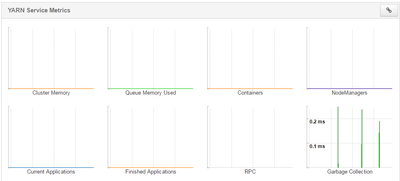
6. There was no error while getting metrics, please see below screenshot when metrics were not visible.
.
How to troubleshoot:
1. Click on any of the metrics, say 'Nodemanagers' --> This will open graph in big window.
2. Open the developer tools from Chrome/Firefox and inspect the network activities.
3. Notice the REST call from where its trying to fetch metrics.
4. Now do the RM failover and try to follow step 1-3 again.
5. Same REST call? No difference.
6. If you flip the RMs, Graphs will start populating the Data.
.
Root Cause:
If you look at hadoop-metrics2.properties file, it has only one RM host(initial rm1) hardcoded for resourcemanager.sink.ganglia.servers