Our Community is getting an upgrade! To get everything ready for the relaunch, we’ll be placing the site in read-only mode starting September 21st.
We really appreciate your understanding while we get things set up behind the scenes. Catch up on all the exciting details about the move here.
Need help or have questions? Drop us a line at [email protected]

Community Articles

Find and share helpful community-sourced technical articles.
Announcements
Share your experience with Cloudera on G2 and get a $25 Amazon Gift card.
Hi, I'm CLEO! Something exciting is coming to the Community. Stay Tuned!

Labels (1)
avatar
Rising Star

Grafana is a popular, open-source graph and dashboard builder ( licensed under Apache License, Version 2.0).

Grafana is feature rich; not only does it let users create customizable and shareable dashboards, it also offers templated/scripted dashboards, LDAP integration, multiple data sources, and more.

Out of the box, Grafana supports data sources such as Graphite, OpenTSDB, ElasticSearch, InfluxDB, CloudWatch, and etc.

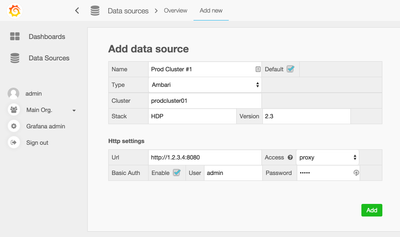
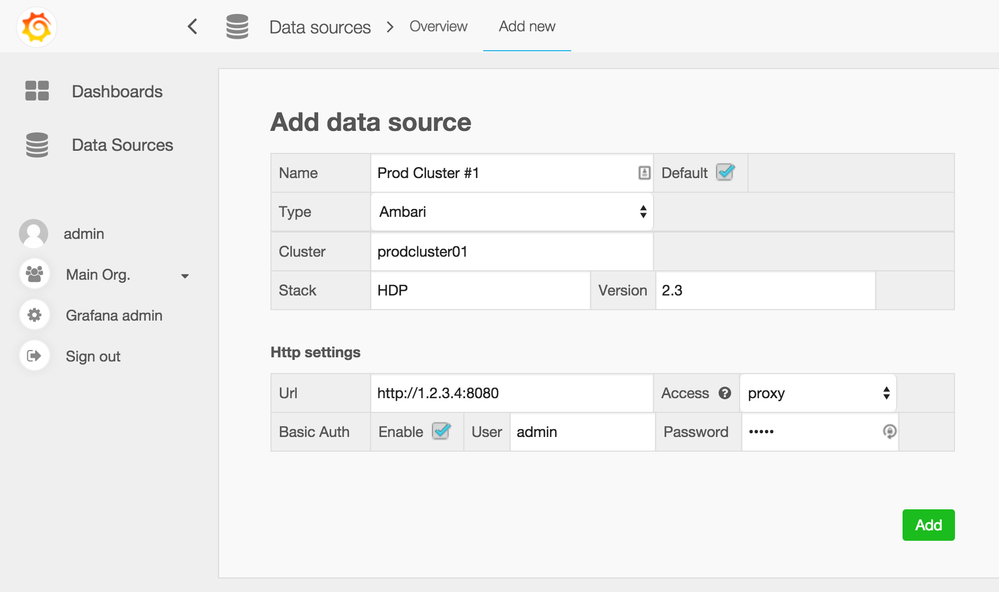
Luckily, the data source part is pluggable; it was not too difficult to create an Ambari data source for it: https://github.com/u39kun/ambari-grafana

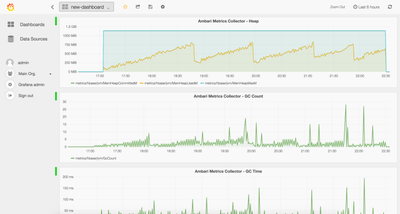
It works for all service metrics currently exposed via Ambari: HDFS, YARN, HBase, Storm, Kafka, Flume, Accumulo, and Ambari Metrics.

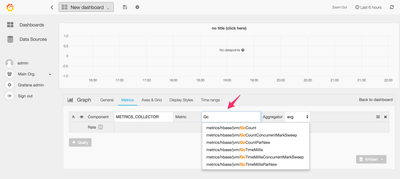
It supports typeahead of component names and their associated metrics, as well as aggregation (“avg”, “sum”, “min”, and “max” of metrics across all instances of the specified component).

Host Metrics are not supported yet, but it shouldn't be too difficult to add.

Please visit https://github.com/u39kun/ambari-grafana/blob/master/README.md for detailed and easy-to-follow instructions on how to install and use Grafana with Ambari as a data source.

Note: Development of the Ambari data source in Grafana was done against Ambari 2.1.2 + HDP 2.3.

366-adding-ambari-data-source-to-grafana.png364-select-metric.png363-dashboard.png


adding-ambari-data-source-to-grafana.png
23,488 Views
Comments
avatar
Rising Star

I would be great if someone can play around and come up with useful and practical Grafana dashboards with the Ambari data source. We can publish these so others can import.

avatar
New Member

Greate idea !!!

avatar
Master Mentor
avatar
Super Collaborator

Thanks @yusaku!

Tried it and it's working. Just had some issues with some components. They're not working (eg KAFKA).

Thanks for the guide!

avatar
New Member

Ambari 2.2.2 now includes Grafana for metrics visualization. There are also pre-built dashboards for HBase, YARN, and HDFS. You can visualize any of the metrics available in Ambari. See: https://hortonworks.com/blog/advanced-metrics-visualization-dashboarding-apache-ambari/

For more information!

avatar
Guru

Latest / Trunk code for the Grafana DataSource can be found here...

https://github.com/apache/ambari/tree/trunk/ambari-metrics/ambari-metrics-grafana

Version history
Last update:
‎08-17-2019 01:53 PM
Updated by:
Contributors