Support Questions
- Cloudera Community
- Support
- Support Questions
- Ambari metrics using 100% cpu
- Subscribe to RSS Feed
- Mark Question as New
- Mark Question as Read
- Float this Question for Current User
- Bookmark
- Subscribe
- Mute
- Printer Friendly Page
- Subscribe to RSS Feed
- Mark Question as New
- Mark Question as Read
- Float this Question for Current User
- Bookmark
- Subscribe
- Mute
- Printer Friendly Page
Ambari metrics using 100% cpu
- Labels:
-
Apache Ambari
-
Apache HBase
Created on 12-16-2015 04:32 PM - edited 08-19-2019 05:32 AM
- Mark as New
- Bookmark
- Subscribe
- Mute
- Subscribe to RSS Feed
- Permalink
- Report Inappropriate Content
I have a HDP 2.3.0 cluster with 4 nodes. I noticed this process was consuming 100% cpu on my NameNode:
ams 5386 223 5.0 3596120 1666616 ? Sl 13:50 46:56 /usr/jdk64/jdk1.8.0_40/bin/java -Dproc_master -XX:OnOutOfMemoryError=kill -9 %p -Xmx1536m -XX:+UseConcMarkSweepGC -XX:ErrorFile=/var/log/ambari-metrics-collector/hs_err_pid%p.log -Djava.io.tmpdir=/opt/var/lib/ambari-metrics-collector/hbase-tmp -Djava.library.path=/usr/lib/ams-hbase/lib/hadoop-native/ -verbose:gc -XX:+PrintGCDetails -XX:+PrintGCDateStamps -Xloggc:/var/log/ambari-metrics-collector/gc.log-201512161350 -Xms1536m -Xmx1536m -Xmn256m -XX:CMSInitiatingOccupancyFraction=70 -XX:+UseCMSInitiatingOccupancyOnly -Dhbase.log.dir=/var/log/ambari-metrics-collector -Dhbase.log.file=hbase-ams-master-NPAA1809.petrobras.biz.log -Dhbase.home.dir=/usr/lib/ams-hbase/bin/.. -Dhbase.id.str=ams -Dhbase.root.logger=INFO,RFA -Dhbase.security.logger=INFO,RFAS org.apache.hadoop.hbase.master.HMaster start
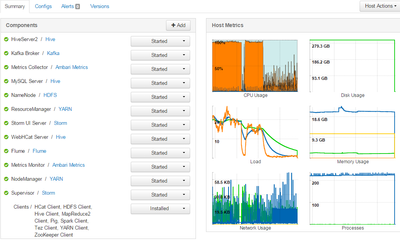
But my cluster does not have Hbase installed. Then I simply killed this process, but Ambari metrics went down together. After I restarted Ambari metrics, this process continues trying to executing and always consuming a lot of CPU. Here is a print of Ambari Metrics durint time of my actions.
How can I configure AMS to stop trying to monitor HBase?
Created 12-16-2015 04:55 PM
- Mark as New
- Bookmark
- Subscribe
- Mute
- Subscribe to RSS Feed
- Permalink
- Report Inappropriate Content
What is the AMS operation mode ("Metrics Service operation mode" config) ?
Please share all the memory configs of AMS along with the memory in the node. The following configs will be useful.
In ams-env - metrics_collector_heapsize
In ams-hbase-env - hbase_regionserver_heapsize,hbase_master_maxperm_size, hbase_master_xmn_size, hbase_regionserver_heapsize, regionserver_xmn_size
and the output of "free -m"
Created 12-16-2015 04:38 PM
- Mark as New
- Bookmark
- Subscribe
- Mute
- Subscribe to RSS Feed
- Permalink
- Report Inappropriate Content
You in fact do have one hbase installed, the one internal to ambari metrics, and it needs to stay running. I think you may have an issue I have seen before, can you add this to your ambari.properties file:
server.timeline.metrics.cache.disabled = true
and then restart ambari, let me know if this helps.
Created 12-16-2015 06:19 PM
- Mark as New
- Bookmark
- Subscribe
- Mute
- Subscribe to RSS Feed
- Permalink
- Report Inappropriate Content
I added this line to ambari.properties and restarted ambari-server, but the 100% cpu behavior stands. Se the screenshot in comment below.
Created 12-16-2015 04:54 PM
- Mark as New
- Bookmark
- Subscribe
- Mute
- Subscribe to RSS Feed
- Permalink
- Report Inappropriate Content
@Vitor BatistaIn terms of CPU consumption, how many CPUs are there on this machine? There are many components on this same machine as shown in attached snapshot (12 service components) which would be reason for 100% CPU consumption. I would be really surprised if AMS itself consumes all CPUs as you have mentioned. You can validate the same theory by moving AMS collector to some other node with lesser number of service components.
On issue of HBase, while you have not installed HBase on the cluster, Ambari Metrics Service internally installs single node HBase cluster on the machine where AMS Collector is installed. And if you kill this Hbase process, AMS service would fail as well as you witnessed. Hope this helps!!
Created 12-16-2015 06:20 PM
- Mark as New
- Bookmark
- Subscribe
- Mute
- Subscribe to RSS Feed
- Permalink
- Report Inappropriate Content
Indeed. I found this "internal HBase" version.
Each node of cluster has 32 GB of RAM and 4 vCores. All of them are virtualized on top of very good hardware.
Created 12-16-2015 06:39 PM
- Mark as New
- Bookmark
- Subscribe
- Mute
- Subscribe to RSS Feed
- Permalink
- Report Inappropriate Content
Cool. You don't have enough resources for so many services to efficiently run on such a small VM. I had another customer facing similar issue in past. Please accept this answer so that we can close this. As a best practice, always accept the answer once that answer is acceptable and resolves the issue.
Created 12-16-2015 06:41 PM
- Mark as New
- Bookmark
- Subscribe
- Mute
- Subscribe to RSS Feed
- Permalink
- Report Inappropriate Content
You did not answered my question completly. I'm the only user on cluster. There's no reason for 100% cpu.
Created 12-16-2015 06:45 PM
- Mark as New
- Bookmark
- Subscribe
- Mute
- Subscribe to RSS Feed
- Permalink
- Report Inappropriate Content
please check cpu core usage from shell on the machine to validate what Ambari is representing. You can use top command for the same.
Created 12-16-2015 09:39 PM
- Mark as New
- Bookmark
- Subscribe
- Mute
- Subscribe to RSS Feed
- Permalink
- Report Inappropriate Content
Ambari Metrics monitor all services / hosts and it consumes resources to run. For small test environments you can stop Ambari Metrics with few cpu, you can stop ambari metrics, it wont affect other components. Our Sandbox, for example, does not have Ambari Metrics started by default.
Created on 12-16-2015 06:49 PM - edited 08-19-2019 05:32 AM
- Mark as New
- Bookmark
- Subscribe
- Mute
- Subscribe to RSS Feed
- Permalink
- Report Inappropriate Content
Since we have 4 vCores, the %CPU sum up to 400.


