Support Questions
- Cloudera Community
- Support
- Support Questions
- Re: CDSW Deploy Model Error Initial Revision
- Subscribe to RSS Feed
- Mark Question as New
- Mark Question as Read
- Float this Question for Current User
- Bookmark
- Subscribe
- Mute
- Printer Friendly Page
- Subscribe to RSS Feed
- Mark Question as New
- Mark Question as Read
- Float this Question for Current User
- Bookmark
- Subscribe
- Mute
- Printer Friendly Page
CDSW Deploy Model Error Initial Revision
Created 10-12-2021 07:08 PM
- Mark as New
- Bookmark
- Subscribe
- Mute
- Subscribe to RSS Feed
- Permalink
- Report Inappropriate Content
Hi All,
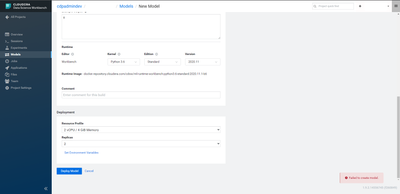
I get the following issue when deploy model to CDSW UI, when I try to deploy a model, the problem that appears is a notification failed to create model
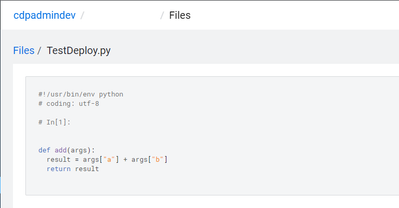
Example python file to deploy
When I try to check the deploy result, the result is initial revision
is there anything that needs to be changed? or maybe someone knows where the log is to see deploy errors on cdsw
Thanks
NA
Created 02-17-2022 10:41 AM
- Mark as New
- Bookmark
- Subscribe
- Mute
- Subscribe to RSS Feed
- Permalink
- Report Inappropriate Content
Any luck on this? I get the same "Unable to load build output." error and I have no means to troubleshoot.
Created 02-17-2022 04:17 PM
- Mark as New
- Bookmark
- Subscribe
- Mute
- Subscribe to RSS Feed
- Permalink
- Report Inappropriate Content
@NajAb8 / @seanbenner ,
Do you see anything in the "Monitoring" tab?
Cheers,
André
Was your question answered? Please take some time to click on "Accept as Solution" below this post.
If you find a reply useful, say thanks by clicking on the thumbs up button.
Created 02-17-2022 04:22 PM
- Mark as New
- Bookmark
- Subscribe
- Mute
- Subscribe to RSS Feed
- Permalink
- Report Inappropriate Content
It says "There are no active model replicas at this time."
Created 02-17-2022 04:50 PM
- Mark as New
- Bookmark
- Subscribe
- Mute
- Subscribe to RSS Feed
- Permalink
- Report Inappropriate Content
Have you trying stopping and starting the model? Or redeploying it?
Was your question answered? Please take some time to click on "Accept as Solution" below this post.
If you find a reply useful, say thanks by clicking on the thumbs up button.
Created 02-17-2022 04:52 PM
- Mark as New
- Bookmark
- Subscribe
- Mute
- Subscribe to RSS Feed
- Permalink
- Report Inappropriate Content
Also, running the command "cdsw logs" as root on the CDSW host will collect logs from the CDSW containers, which you can use to troubleshoot.
Was your question answered? Please take some time to click on "Accept as Solution" below this post.
If you find a reply useful, say thanks by clicking on the thumbs up button.
Created 02-17-2022 06:04 PM
- Mark as New
- Bookmark
- Subscribe
- Mute
- Subscribe to RSS Feed
- Permalink
- Report Inappropriate Content
I will have to find out where the host is. Then I'll look for logs
Created 02-17-2022 07:26 PM
- Mark as New
- Bookmark
- Subscribe
- Mute
- Subscribe to RSS Feed
- Permalink
- Report Inappropriate Content
This may be related to insufficient resources on your environment.
Could you share a screenshot of the Cluster Metrics table you can find under Admin > Overview?
On that same page you can also find a link to a Grafana Dashboard where you can check the resource utilisation at various levels.
Regards,
André
Was your question answered? Please take some time to click on "Accept as Solution" below this post.
If you find a reply useful, say thanks by clicking on the thumbs up button.


