Support Questions
- Cloudera Community
- Support
- Support Questions
- Datanode Failures: DataXceiver error processing WR...
- Subscribe to RSS Feed
- Mark Question as New
- Mark Question as Read
- Float this Question for Current User
- Bookmark
- Subscribe
- Mute
- Printer Friendly Page
- Subscribe to RSS Feed
- Mark Question as New
- Mark Question as Read
- Float this Question for Current User
- Bookmark
- Subscribe
- Mute
- Printer Friendly Page
Datanode Failures: DataXceiver error processing WRITE_BLOCK/READ_BLOCK operation
- Labels:
-
Apache Hadoop
Created 03-24-2017 08:44 PM
- Mark as New
- Bookmark
- Subscribe
- Mute
- Subscribe to RSS Feed
- Permalink
- Report Inappropriate Content
I have been experiencing failures with my datanodes and the error is WRITE_BLOCK and READ_BLOCK. I have checked the data handlers and i have dfs.datanode.max.transfer.threads set to 16384. I run HDP 2.4.3 with 11 nodes. Please see error below;
2017-03-24 10:09:59,749 ERROR datanode.DataNode (DataXceiver.java:run(278)) - dn:50010:DataXceiver error processing READ_BLOCK operation  src: /ip_address:49591 dst: /ip_address:50010

2017-03-24 11:02:18,750 ERROR datanode.DataNode (DataXceiver.java:run(278)) - dn:50010:DataXceiver error processing WRITE_BLOCK operation  src: /ip_address:43052 dst: /ip_address:50010
Created 03-24-2017 09:09 PM
- Mark as New
- Bookmark
- Subscribe
- Mute
- Subscribe to RSS Feed
- Permalink
- Report Inappropriate Content
Can you post the full stack trace. That might help to debug this. Thanks
Created 03-25-2017 08:26 AM
- Mark as New
- Bookmark
- Subscribe
- Mute
- Subscribe to RSS Feed
- Permalink
- Report Inappropriate Content
Created 03-27-2017 09:16 PM
- Mark as New
- Bookmark
- Subscribe
- Mute
- Subscribe to RSS Feed
- Permalink
- Report Inappropriate Content
In the posted stack trace, there are lot of GC pauses.
Below is a good article explaining Namenode Garbage Collection practices:
Created 03-25-2017 02:10 AM
- Mark as New
- Bookmark
- Subscribe
- Mute
- Subscribe to RSS Feed
- Permalink
- Report Inappropriate Content
for writing issue. if you share more information also gets better understanding.
1) Check Data node is listing in Ambari WI
2) if data node is fine, it may be the jira as below.
Created 03-25-2017 08:31 AM
- Mark as New
- Bookmark
- Subscribe
- Mute
- Subscribe to RSS Feed
- Permalink
- Report Inappropriate Content
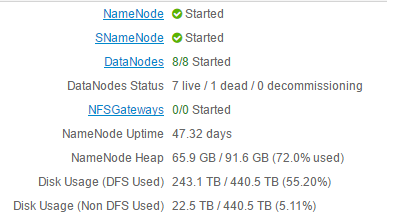
@zkfs Failed datanode is still listed in Ambari UI but there is a connection failed alert and running the hdfs dfsadmin -report command shows the dead datanodes.
Created 03-27-2017 06:37 PM
- Mark as New
- Bookmark
- Subscribe
- Mute
- Subscribe to RSS Feed
- Permalink
- Report Inappropriate Content
Hi @Joshua Adeleke, how frequently do you see the errors. These are some times seen in busy clusters and usually clients/HDFS recover from transient failures.
If there are no job or task failures around the time you of the errors, I would just ignore them.
Edit: I took a look at your attached log file. There's a lot of GC pauses as @Namit Maheshwari pointed out.
Try increasing the DataNode heap size and PermGen/NewGen allocations until the GC pauses go away.
2017-03-25 10:10:18,219 WARN  util.JvmPauseMonitor (JvmPauseMonitor.java:run(192)) - Detected pause in JVM or host machine (eg GC): pause of approximately 44122ms
GC pool 'ConcurrentMarkSweep' had collection(s): count=1 time=44419ms
Created 03-27-2017 11:42 PM
- Mark as New
- Bookmark
- Subscribe
- Mute
- Subscribe to RSS Feed
- Permalink
- Report Inappropriate Content
Hello @Arpit Agarwal, the errors are quite frequent and I just restarted 2 data nodes now. Infact, 4 out of 8 data nodes have been restarted in the last 6 hours.
Created 03-27-2017 11:46 PM
- Mark as New
- Bookmark
- Subscribe
- Mute
- Subscribe to RSS Feed
- Permalink
- Report Inappropriate Content
Just curious - why did you restart the Data Nodes? Did they crash?
Created 03-28-2017 06:54 AM
- Mark as New
- Bookmark
- Subscribe
- Mute
- Subscribe to RSS Feed
- Permalink
- Report Inappropriate Content
Yes, the datanodes crashed @Arpit Agarwal. hdfs dfsadmin -report command is more accurate in reporting the datanode failure.


