Support Questions
- Cloudera Community
- Support
- Support Questions
- Re: Failed to start service via Cloudera manager
- Subscribe to RSS Feed
- Mark Question as New
- Mark Question as Read
- Float this Question for Current User
- Bookmark
- Subscribe
- Mute
- Printer Friendly Page
- Subscribe to RSS Feed
- Mark Question as New
- Mark Question as Read
- Float this Question for Current User
- Bookmark
- Subscribe
- Mute
- Printer Friendly Page
Failed to start service via Cloudera manager
- Labels:
-
Cloudera Manager
Created on 12-10-2013 06:47 PM - edited 09-16-2022 01:51 AM
- Mark as New
- Bookmark
- Subscribe
- Mute
- Subscribe to RSS Feed
- Permalink
- Report Inappropriate Content
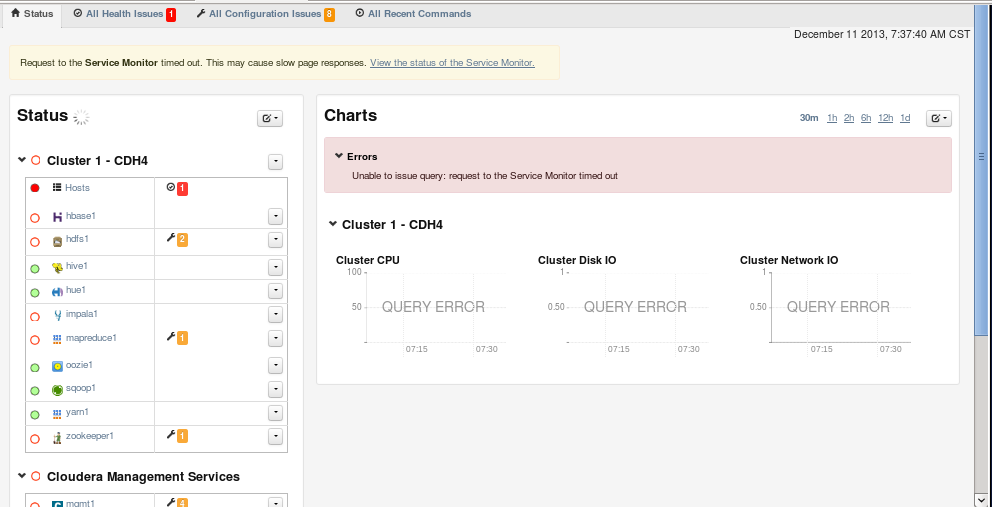
After using Installation Path A - Automated Installation by Cloudera Manager , system gives the following tips:Congratulation!But when I enter mylocal:7180 in Firefox,The page is shown below
Can anyone tell me why I encounters this Errors: 'Unable to issue query :request to the Service Monitor:timed out'in Charts Section?
Thanks.
Created 12-11-2013 09:28 AM
- Mark as New
- Bookmark
- Subscribe
- Mute
- Subscribe to RSS Feed
- Permalink
- Report Inappropriate Content
It appears that your "Service Monitor" service is unable to connect to it's underlying database. During the installation process of CM, there was a screen that would have asked you to configure your database connections for the various databases used by the "mgmt1" services of Cloudera Manager. Did you modify any of the default settings on that screen and/or click the "Test Connection" button there? CM will default to a postgresql database for these dbs unless you change it to point to MySQL or a db of your choice.
Created 12-11-2013 10:31 PM
- Mark as New
- Bookmark
- Subscribe
- Mute
- Subscribe to RSS Feed
- Permalink
- Report Inappropriate Content
First thanks for your reply.You are right.In this step,I'm really click the "Test Connection" button there.You mean I don't need to click this button and move on to the next step,right?
Created 12-11-2013 10:41 PM
- Mark as New
- Bookmark
- Subscribe
- Mute
- Subscribe to RSS Feed
- Permalink
- Report Inappropriate Content
The test connection page won't let you proceed unless your connection is valid.
Did you modify your service monitory database settings manually, after setting up the service?
What do the log messages say for the Service Monitor? Click on your Management Service, click on Service Monitory, click on the Processes tab, and look for any interesting messages in stderr, stdout, and the role log.
Created 06-02-2014 12:53 AM
- Mark as New
- Bookmark
- Subscribe
- Mute
- Subscribe to RSS Feed
- Permalink
- Report Inappropriate Content
Hello All,
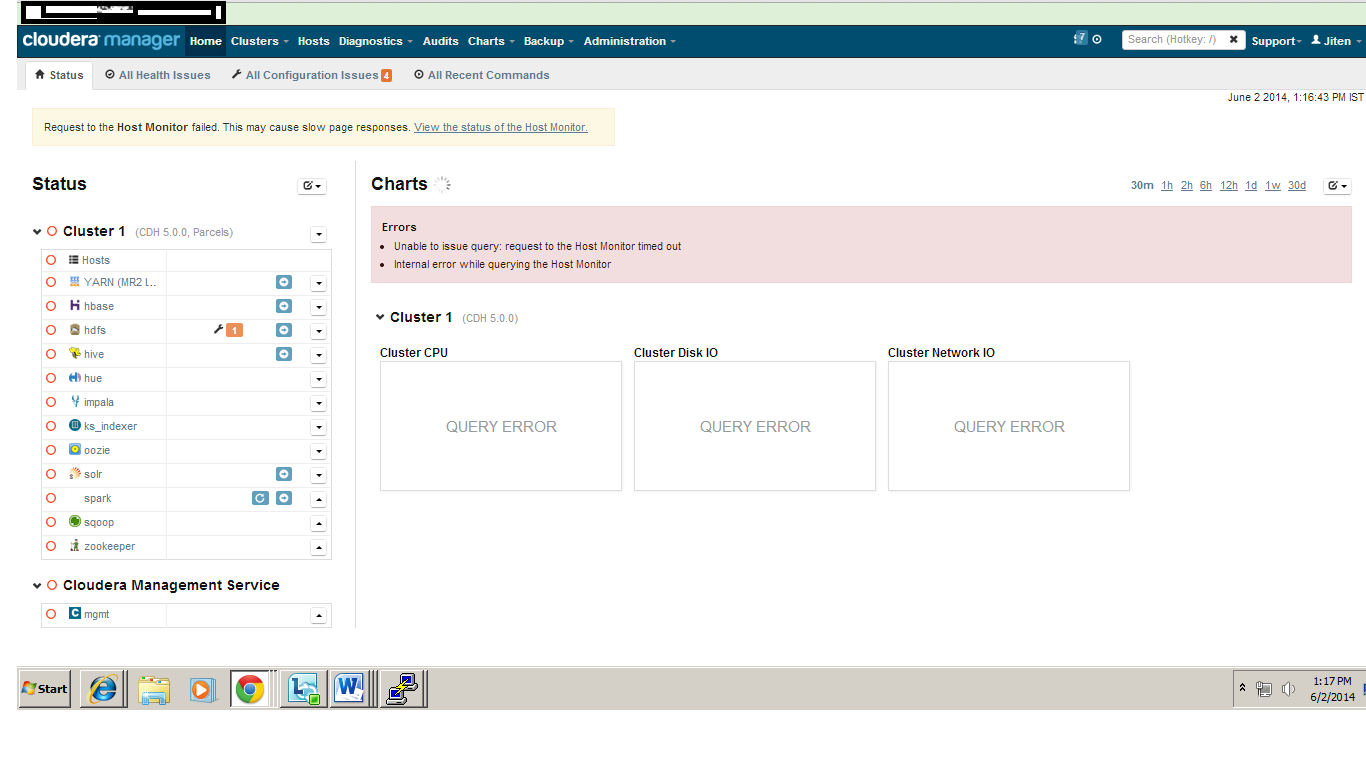
I am getting same error. Kindly go through the below image.
It was working earlier, but after restarting Cluster, it is giving me above error and working very slow. Kindly help.
Please let me know how to resolve the issue......
Regards,
Jiten
Created 06-02-2014 09:09 AM
- Mark as New
- Bookmark
- Subscribe
- Mute
- Subscribe to RSS Feed
- Permalink
- Report Inappropriate Content
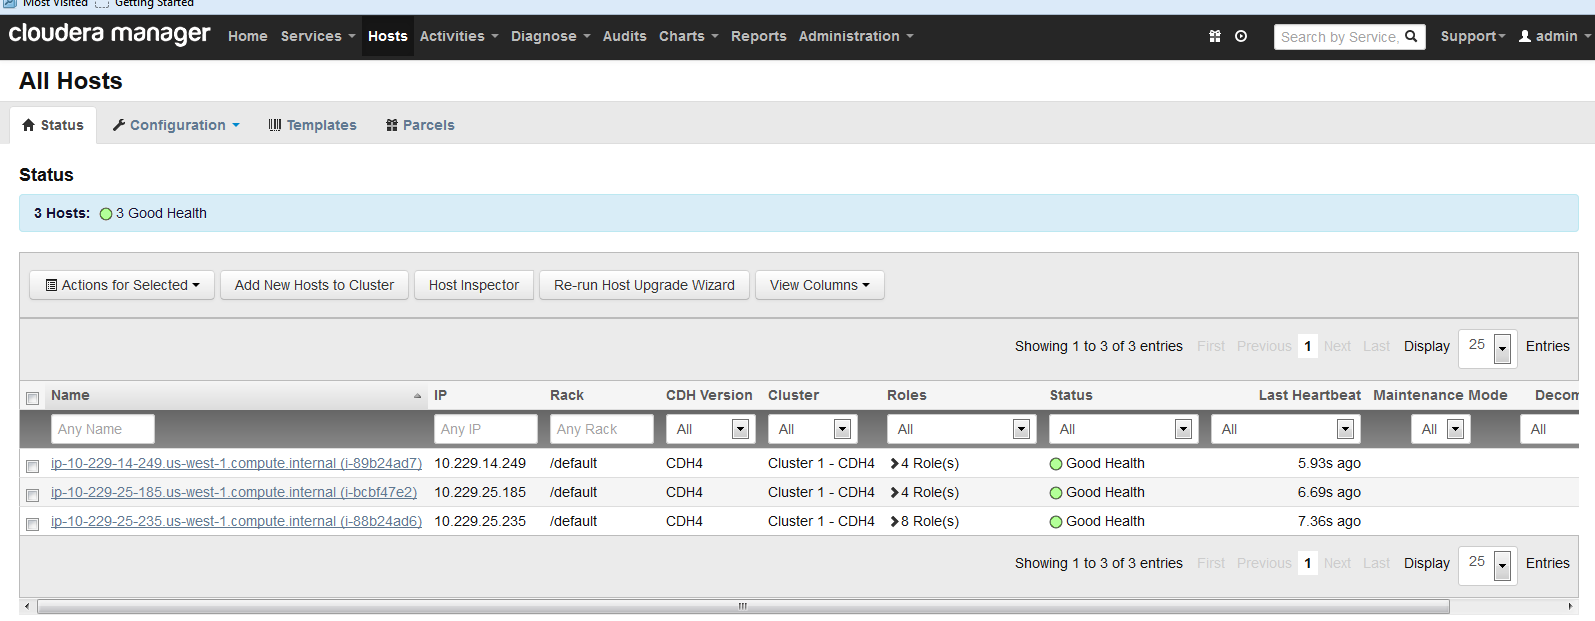
Click the host button and check the heartbeat ..If your not getting heartbeat then you need to reinstall the host because your ip settings maybe DHCP
Created 06-03-2014 04:25 AM
- Mark as New
- Bookmark
- Subscribe
- Mute
- Subscribe to RSS Feed
- Permalink
- Report Inappropriate Content
Hello,
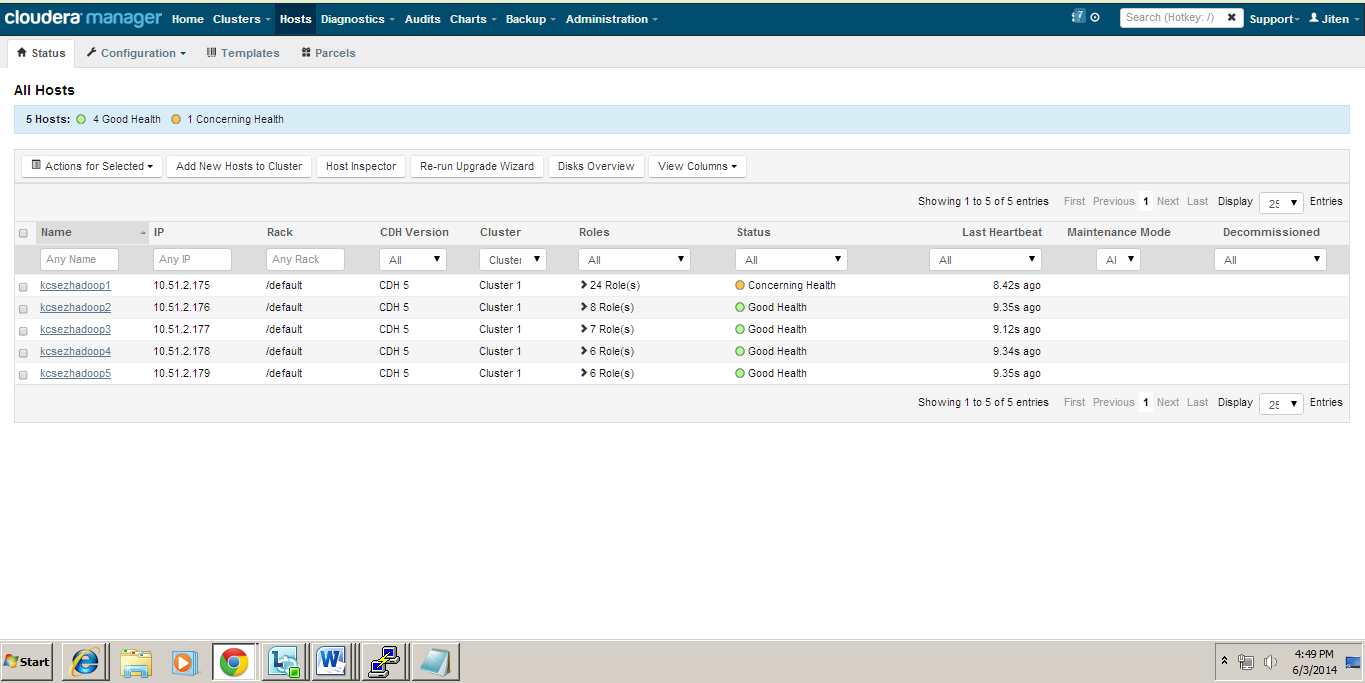
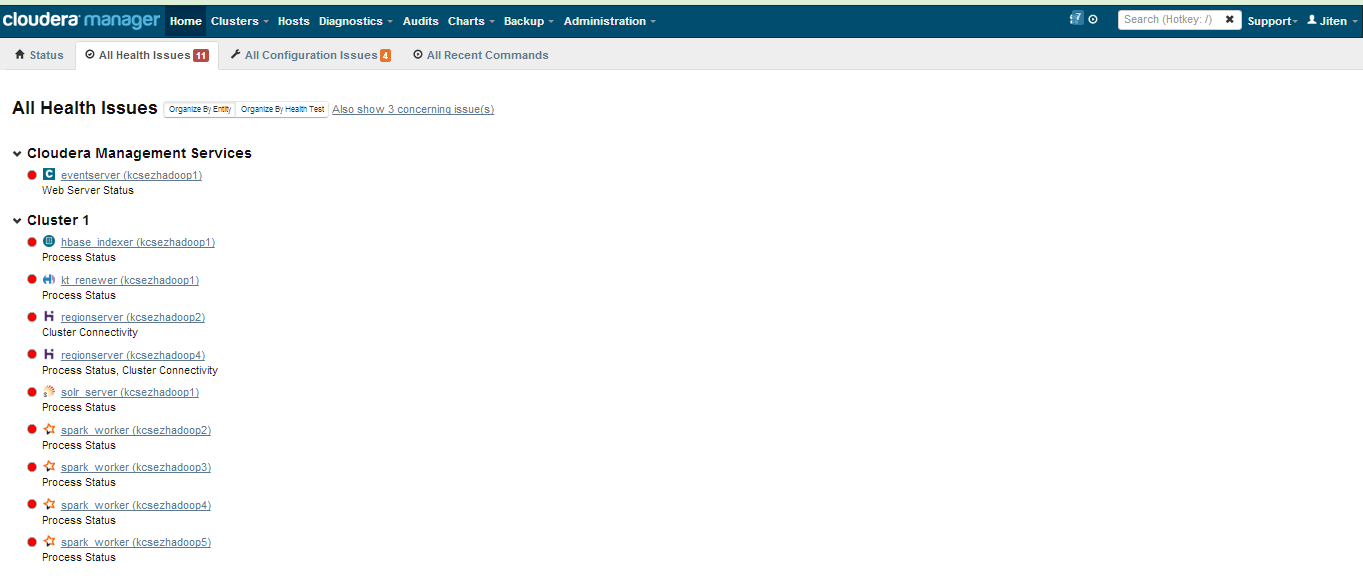
Thank you for your reply, i am getting heartbeat now. But still it is responding too slow. Kindly go through the below images.
I am facing below Health issues, kindly help.
Thanks & Regards,
Jiten Pansara
Created on 06-03-2014 08:32 AM - edited 06-03-2014 08:35 AM
- Mark as New
- Bookmark
- Subscribe
- Mute
- Subscribe to RSS Feed
- Permalink
- Report Inappropriate Content
Created 06-03-2014 09:45 AM
- Mark as New
- Bookmark
- Subscribe
- Mute
- Subscribe to RSS Feed
- Permalink
- Report Inappropriate Content
I had similar issue, heartbeat is good, but no charts. this is firewall issue. i worked with network people to open ports and certain ip addresses.
Created 06-04-2014 12:27 AM
- Mark as New
- Bookmark
- Subscribe
- Mute
- Subscribe to RSS Feed
- Permalink
- Report Inappropriate Content
Hello,
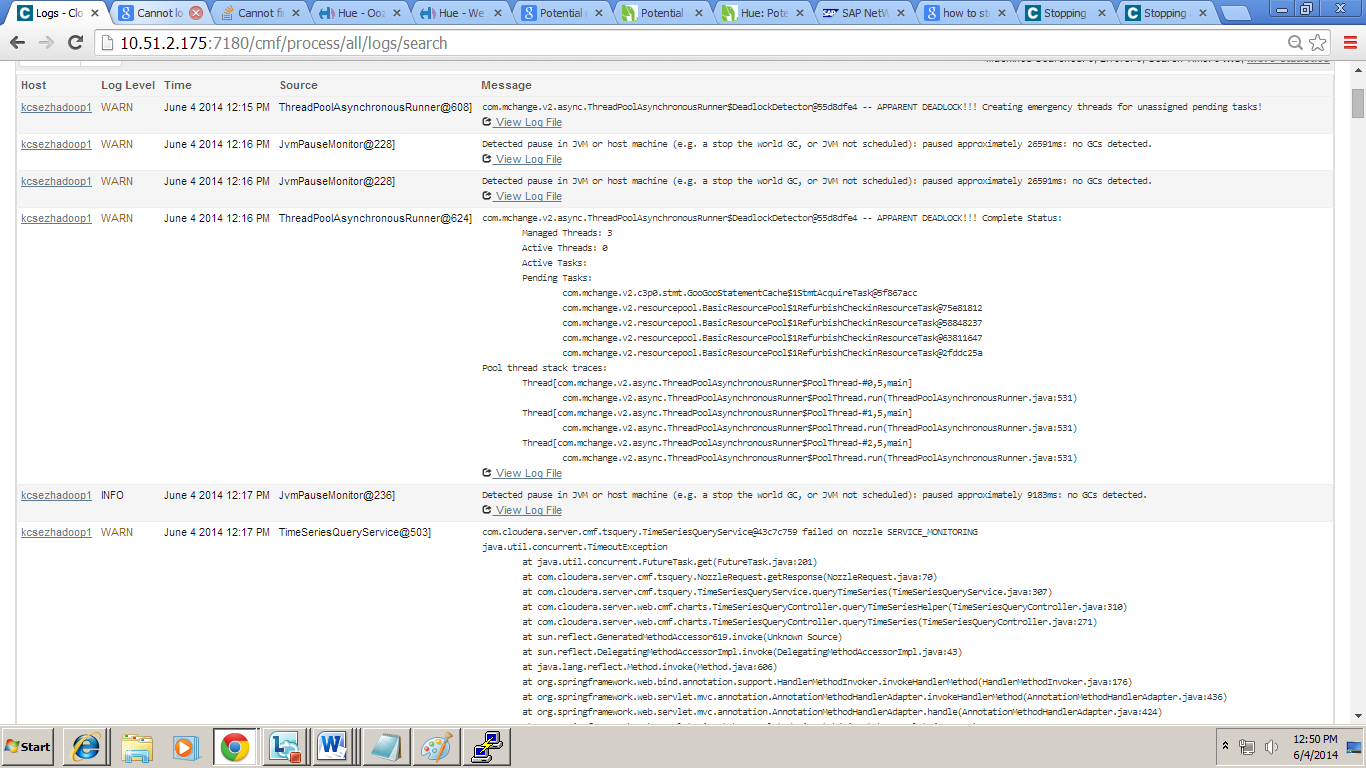
Thanks for the reply. Please go through the below errors which we are getting.
Thanks & Regards,
Jiten Pansara
