Support Questions
- Cloudera Community
- Support
- Support Questions
- Re: GC Duration warnings on CDH 5.5.1 cluster
- Subscribe to RSS Feed
- Mark Question as New
- Mark Question as Read
- Float this Question for Current User
- Bookmark
- Subscribe
- Mute
- Printer Friendly Page
- Subscribe to RSS Feed
- Mark Question as New
- Mark Question as Read
- Float this Question for Current User
- Bookmark
- Subscribe
- Mute
- Printer Friendly Page
GC Duration warnings on CDH 5.5.1 cluster
Created on 05-02-2016 11:51 AM - edited 09-16-2022 03:16 AM
- Mark as New
- Bookmark
- Subscribe
- Mute
- Subscribe to RSS Feed
- Permalink
- Report Inappropriate Content
Hi,
We recently started getting the GC warnings on our Yarn and all nodes of Production cluster frequently, so want to avoid this warnings. Please someone can help us to resolve this issue as soon as possible.
Following is the warning:
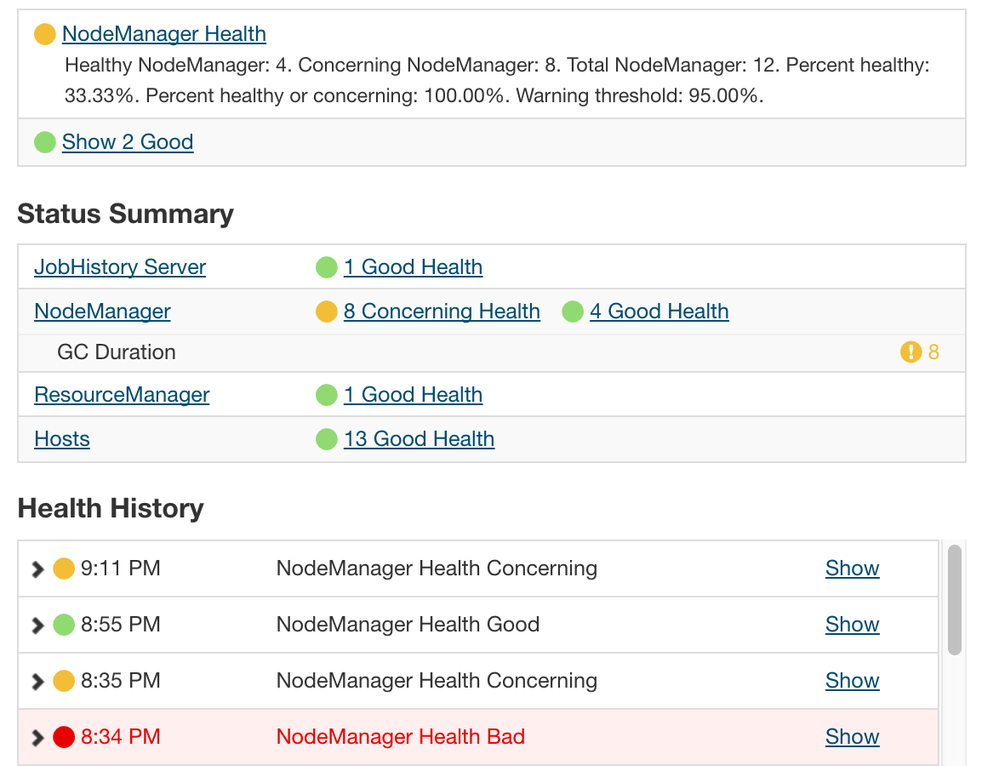
Test of whether this role spends too much time in garbage collection. Concerning
Created 05-02-2016 05:24 PM
- Mark as New
- Bookmark
- Subscribe
- Mute
- Subscribe to RSS Feed
- Permalink
- Report Inappropriate Content
you will need to append "
-Xms512m -Xmx1024m -XX:PermSize=216m -XX:MaxPermSize=512m
"
to the property Java Configuration Options for Node Manager, and then restart Node Managers. You'll want to change the numbers for -Xmx and -XX:MaxPermSize to values bigger than what you currently have for Node Manager. Please try to do this in a test enviroment first as this may impact on your production cluster.
Created 05-02-2016 02:16 PM
- Mark as New
- Bookmark
- Subscribe
- Mute
- Subscribe to RSS Feed
- Permalink
- Report Inappropriate Content
What is exactly the role that had this warning message?
Created 05-02-2016 02:26 PM
- Mark as New
- Bookmark
- Subscribe
- Mute
- Subscribe to RSS Feed
- Permalink
- Report Inappropriate Content
Node Manager
Created 05-02-2016 02:28 PM
- Mark as New
- Bookmark
- Subscribe
- Mute
- Subscribe to RSS Feed
- Permalink
- Report Inappropriate Content
Created 05-02-2016 02:42 PM
- Mark as New
- Bookmark
- Subscribe
- Mute
- Subscribe to RSS Feed
- Permalink
- Report Inappropriate Content
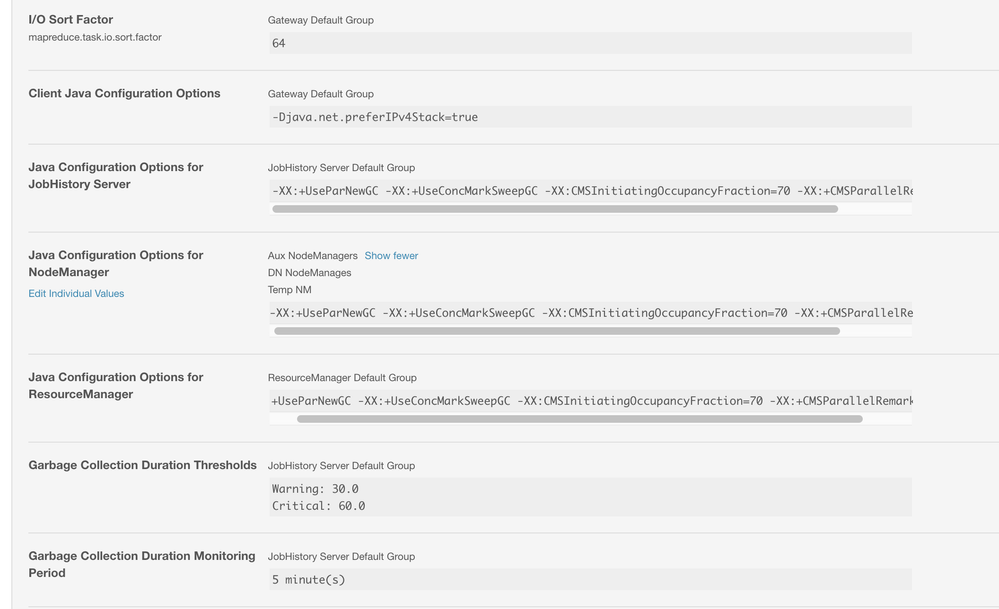
Following is the default configuration for garbage collection:
Created 05-02-2016 03:12 PM
- Mark as New
- Bookmark
- Subscribe
- Mute
- Subscribe to RSS Feed
- Permalink
- Report Inappropriate Content
Jais, for some reason, the configuration is not visiable to me. Can you copy and paste it here as text?
Created 05-02-2016 03:19 PM
- Mark as New
- Bookmark
- Subscribe
- Mute
- Subscribe to RSS Feed
- Permalink
- Report Inappropriate Content
Created 05-02-2016 04:19 PM
- Mark as New
- Bookmark
- Subscribe
- Mute
- Subscribe to RSS Feed
- Permalink
- Report Inappropriate Content
Which version of java are you using? I do not know much about GC tuning, but heap size can lead to GC pause sometimes, you can try to increaes the heap size of Node Manager if that is possible. You can also try to collect gc logs by adding java options temporarily "-XX:+PrintGCDetails -XX:+PrintHeapAtGC -XX:+PrintGCTimeStamps -XX:+PrintGCDateStamps -XX:+PrintGCApplicationStoppedTime -XX:PrintFLSStatistics=2"
Created on 05-02-2016 04:41 PM - edited 05-02-2016 04:44 PM
- Mark as New
- Bookmark
- Subscribe
- Mute
- Subscribe to RSS Feed
- Permalink
- Report Inappropriate Content
Java version we are using is "1.8.0_51".
What property do we need to reset for increasing heap size.
Is it
Created 05-02-2016 05:24 PM
- Mark as New
- Bookmark
- Subscribe
- Mute
- Subscribe to RSS Feed
- Permalink
- Report Inappropriate Content
you will need to append "
-Xms512m -Xmx1024m -XX:PermSize=216m -XX:MaxPermSize=512m
"
to the property Java Configuration Options for Node Manager, and then restart Node Managers. You'll want to change the numbers for -Xmx and -XX:MaxPermSize to values bigger than what you currently have for Node Manager. Please try to do this in a test enviroment first as this may impact on your production cluster.


