Support Questions
- Cloudera Community
- Support
- Support Questions
- Getting null device message while displaying ggplo...
- Subscribe to RSS Feed
- Mark Question as New
- Mark Question as Read
- Float this Question for Current User
- Bookmark
- Subscribe
- Mute
- Printer Friendly Page
- Subscribe to RSS Feed
- Mark Question as New
- Mark Question as Read
- Float this Question for Current User
- Bookmark
- Subscribe
- Mute
- Printer Friendly Page
Getting null device message while displaying ggplots in Zeppelin 0.6.0
- Labels:
-
Apache Spark
-
Apache Zeppelin
Created 12-07-2016 10:18 PM
- Mark as New
- Bookmark
- Subscribe
- Mute
- Subscribe to RSS Feed
- Permalink
- Report Inappropriate Content
Hi guys,
I am trying to display ggplots from Zeppelin Livy SparkR interpreter. I get something like ggplot-nullmessage.png. I also tried using ggsave to save the plots to the disk and it is working fine,
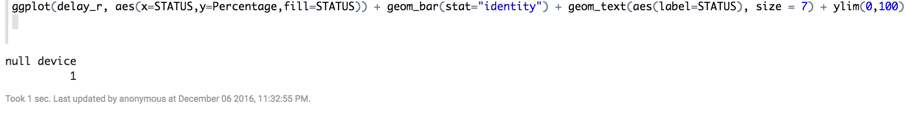
ggplot(delay_r, aes(x=STATUS,y=Percentage,fill=STATUS)) + geom_bar(stat="identity") + geom_text(aes(label=STATUS), size = 7) + ylim(0,100)
ggsave(file="/tmp/plot.png")
Can someone please guide me to display this plot in Zeppelin only?
Created 12-19-2016 05:02 AM
- Mark as New
- Bookmark
- Subscribe
- Mute
- Subscribe to RSS Feed
- Permalink
- Report Inappropriate Content
Make sure R and it's libraries are installed: https://zeppelin.apache.org/docs/0.6.0/interpreter/r.html
stop zeppelin!
yum install R R-devel libcurl-devel openssl-devel
+ devtools with `R -e "install.packages('devtools', repos = 'http://cran.us.r-project.org')"`
+ knitr with `R -e "install.packages('knitr', repos = 'http://cran.us.r-project.org')"`
+ ggplot2 with `R -e "install.packages('ggplot2', repos = 'http://cran.us.r-project.org')"`
+ Other vizualisation librairies: `R -e "install.packages(c('devtools','mplot', 'googleVis'), repos = 'http://cran.us.r-project.org'); require(devtools); install_github('ramnathv/rCharts')"`
then restart zeppelin
test R scripts from the command line
Created 12-12-2016 05:31 PM
- Mark as New
- Bookmark
- Subscribe
- Mute
- Subscribe to RSS Feed
- Permalink
- Report Inappropriate Content
Please help guys, I am kind of stuck here.
Created 12-19-2016 05:02 AM
- Mark as New
- Bookmark
- Subscribe
- Mute
- Subscribe to RSS Feed
- Permalink
- Report Inappropriate Content
Make sure R and it's libraries are installed: https://zeppelin.apache.org/docs/0.6.0/interpreter/r.html
stop zeppelin!
yum install R R-devel libcurl-devel openssl-devel
+ devtools with `R -e "install.packages('devtools', repos = 'http://cran.us.r-project.org')"`
+ knitr with `R -e "install.packages('knitr', repos = 'http://cran.us.r-project.org')"`
+ ggplot2 with `R -e "install.packages('ggplot2', repos = 'http://cran.us.r-project.org')"`
+ Other vizualisation librairies: `R -e "install.packages(c('devtools','mplot', 'googleVis'), repos = 'http://cran.us.r-project.org'); require(devtools); install_github('ramnathv/rCharts')"`
then restart zeppelin
test R scripts from the command line
Created 12-19-2016 05:06 AM
- Mark as New
- Bookmark
- Subscribe
- Mute
- Subscribe to RSS Feed
- Permalink
- Report Inappropriate Content
https://support.rstudio.com/hc/en-us/articles/200488548-Problem-with-Plots-or-Graphics-Device
post your notebook
also make sure you are doing your code in a
%spark.r
hist(ed) is the format
Almost all issues with the R interpreter turned out to be caused by an incorrectly set SPARK_HOME. The R interpreter must load a version of the SparkR package that matches the running version of Spark, and it does this by searching SPARK_HOME. If Zeppelin isn't configured to interface with Spark in SPARK_HOME, the R interpreter will not be able to connect to Spark.
see: https://github.com/datalayer/zeppelin-datalayer/issues/2
Try to run this notebook

