Support Questions
- Cloudera Community
- Support
- Support Questions
- Re: Help diagnosing slow query (even though fast h...
- Subscribe to RSS Feed
- Mark Question as New
- Mark Question as Read
- Float this Question for Current User
- Bookmark
- Subscribe
- Mute
- Printer Friendly Page
- Subscribe to RSS Feed
- Mark Question as New
- Mark Question as Read
- Float this Question for Current User
- Bookmark
- Subscribe
- Mute
- Printer Friendly Page
Help diagnosing slow query (even though fast hdfs scan)
- Labels:
-
Apache Impala
-
HDFS
Created on 11-04-2016 02:39 PM - edited 09-16-2022 03:46 AM
- Mark as New
- Bookmark
- Subscribe
- Mute
- Subscribe to RSS Feed
- Permalink
- Report Inappropriate Content
Hello everyone, trying to hunt down some slow query times here.
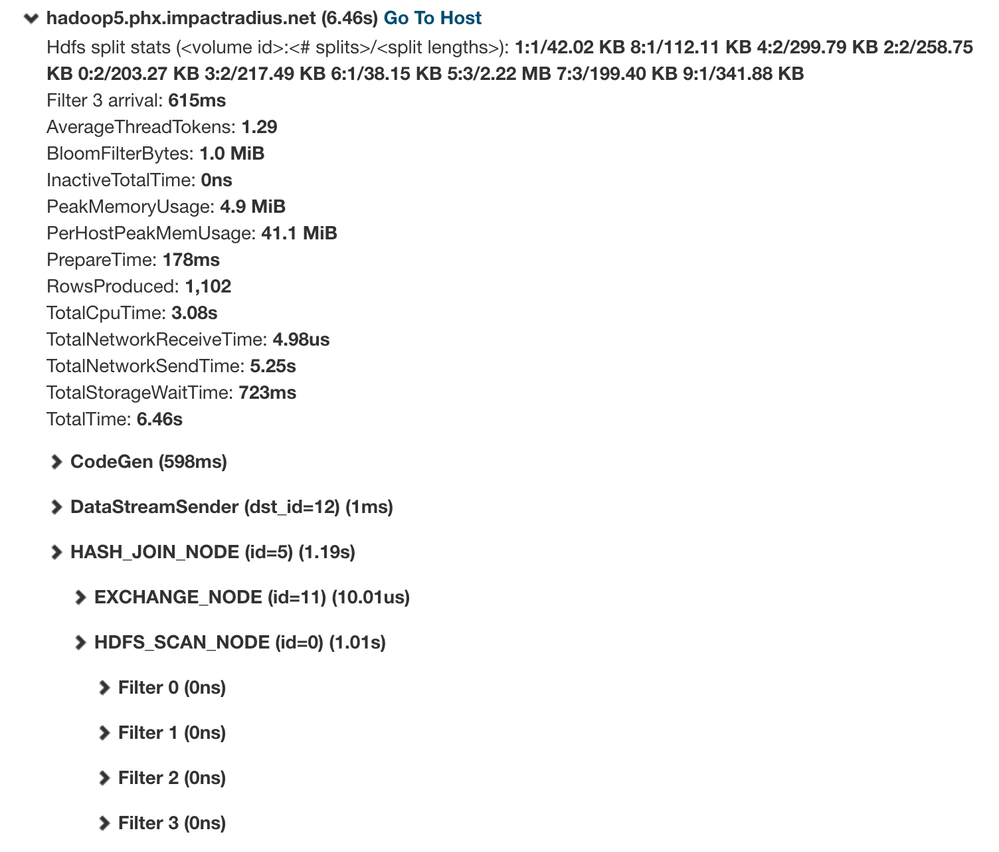
Focusing on just one type of query, it normally runs in about 1 second, but about 1/3 of the time it takes 6 or even 8 seconds. Looking at the profile of a slow run, hdfs scans are super fast (under 1 second and usually closer to 400ms) in all 22 nodes, as expected, because we're partition pruning aggresively and using hdfs caching, HOWEVER the entire 00 fragment takes a whole 6 seconds, most of it in TotalNetworkSendTime.
How can I know what send time to which other plan node is the culprit, since this node (00) seems to be connected to all other nodes in the plan (query has 4 inner joins)?
Using CDH 5.7 Happy to send entire profile directly, but don't want to post publicly.
Thanks in advance!
-m
|
00:SCAN HDFS [irdw_prod.agg_daily_activity_cam_mp_client_performance fact, RANDOM]
   partitions=2/482 files=194 size=76.01MB
   runtime filters: RF000 -> event_date_local_dim_id, RF001 -> fact.client_dim_id, RF002 -> fact.media_dim_id, RF003 -> campaign_dim_id
   table stats: 1006261351 rows total
   column stats: all
   hosts=22 per-host-mem=320.00MB
   tuple-ids=0 row-size=88B cardinality=4259958
Created 11-07-2016 02:34 PM
- Mark as New
- Bookmark
- Subscribe
- Mute
- Subscribe to RSS Feed
- Permalink
- Report Inappropriate Content
We could definitely improve some of the diagnostics there. My guess is that one node is either overloaded or has some kind of hardware issue - might be worth looking at the health and CPU/memory usage of different nodes to see if one stands out.
Created on 11-04-2016 05:25 PM - edited 11-04-2016 05:26 PM
- Mark as New
- Bookmark
- Subscribe
- Mute
- Subscribe to RSS Feed
- Permalink
- Report Inappropriate Content
One thing to keep in mind when interpreting the profiles is that a series of joins will typically be pipelined to avoid materialising results. This means that the whole pipeline runs at the speed of the slowest part of the pipeline. So the limiting factor could be the client (if you're returning a lot of results), the scan at the bottom of the plan, or any of the joins in the pipeline.
TotalNetworkSendTime may be somewhat misleading since if the sender is running faster than the receiver, a backpressure mechanism kicks in that blocks the sender until the receiver has caught up.
What's I'd recommend initially is comparing query summaries of the fast and slow queries to see where the difference in time is.
If you're running in impala-shell you can get the summary of the last query by typing "summary;"
Created on 11-04-2016 08:10 PM - edited 11-04-2016 08:20 PM
- Mark as New
- Bookmark
- Subscribe
- Mute
- Subscribe to RSS Feed
- Permalink
- Report Inappropriate Content
Thanks so much Tim.
I compared summaries out of profiles from a fast and a slow run of the (basically) same query. They are pretty much the same!! however I did notice in the timeline that the slow query took 6 seconds before 'ready to start fragments' and 'all fragments started'.
So I guess there were some straggler nodes, but outside of fragment processing because none of the 'Max Time' values look high:
FAST:

Operator              #Hosts   Avg Time   Max Time    #Rows  Est. #Rows   Peak Mem  Est. Peak Mem  Detail
----------------------------------------------------------------------------------------------------------------------------------
20:MERGING-EXCHANGE        1   99.260us   99.260us        7          10          0        -1.00 B  UNPARTITIONED
10:SORT                   22  677.665us  828.653us        7          10   24.02 MB       16.00 MB
19:AGGREGATE              22  201.337ms  244.372ms        7          10    2.28 MB       10.00 MB  FINALIZE
18:EXCHANGE               22   20.432us  140.472us       28          10          0              0  HASH(CASE WHEN cld.platform...
09:AGGREGATE              22  219.170ms  287.685ms       28          10    1.98 MB       10.00 MB  STREAMING
08:HASH JOIN              22    7.359ms   71.569ms  153.93K         851    2.04 MB       761.00 B  INNER JOIN, PARTITIONED
|--17:EXCHANGE            22    7.094us   20.544us        7         761          0              0  HASH(dd.id)
|  04:SCAN HDFS            1    8.870ms    8.870ms        7         761  175.15 KB       32.00 MB  irdw_prod.date_dim dd
16:EXCHANGE               22    1.589ms    8.964ms  183.28K         851          0              0  HASH(event_date_local_dim_id)
07:HASH JOIN              22  200.085ms  267.669ms  183.28K         851   12.04 MB        1.71 MB  INNER JOIN, PARTITIONED
|--15:EXCHANGE            22    1.728ms    2.233ms    1.43M       1.43M          0              0  HASH(cld.id)
|  03:SCAN HDFS            2   11.642ms   12.940ms    1.43M       1.43M   11.59 MB       64.00 MB  irdw_prod.client_dim cld
14:EXCHANGE               22    1.203ms    2.218ms  183.28K         851          0              0  HASH(fact.client_dim_id)
06:HASH JOIN              22  204.626ms  256.269ms  183.28K         851    6.03 MB      428.48 KB  INNER JOIN, PARTITIONED
|--13:EXCHANGE            22    2.719ms   11.037ms    2.19M       2.19M          0              0  HASH(md.id)
|  02:SCAN HDFS            8    4.838ms    6.003ms    2.19M       2.19M    6.11 MB       40.00 MB  irdw_prod.media_dim md
12:EXCHANGE               22  825.834us    4.673ms  183.28K         851          0              0  HASH(fact.media_dim_id)
05:HASH JOIN              22  199.360ms  253.233ms  183.28K         851    2.02 MB        18.00 B  INNER JOIN, BROADCAST
|--11:EXCHANGE            22    8.630us   10.408us        3           2          0              0  BROADCAST
|  01:SCAN HDFS            1   23.969ms   23.969ms        3           2  181.51 KB       32.00 MB  irdw_prod.campaign_dim cd
00:SCAN HDFS              22  814.857ms    1s106ms  183.28K       2.86M    3.18 MB      320.00 MB  irdw_prod.agg_daily_activit...

      Ready to start 122 remote fragments: 24,632,776
      All 122 remote fragments started: 40,539,024
      First dynamic filter received: 523,467,712
      Rows available: 1,742,258,728


SLOW:

Operator              #Hosts   Avg Time   Max Time   #Rows  Est. #Rows   Peak Mem  Est. Peak Mem  Detail
---------------------------------------------------------------------------------------------------------------------------------
20:MERGING-EXCHANGE        1  115.304us  115.304us       4          10          0        -1.00 B  UNPARTITIONED
10:SORT                   22  711.942us  971.640us       4          10   24.02 MB       16.00 MB
19:AGGREGATE              22  224.158ms  356.244ms       4          10    2.28 MB       10.00 MB  FINALIZE
18:EXCHANGE               22   17.424us  116.992us      24          10          0              0  HASH(CASE WHEN cld.platform...
09:AGGREGATE              22  239.932ms  376.739ms      24          10    1.98 MB       10.00 MB  STREAMING
08:HASH JOIN              22    9.258ms  126.508ms   7.00K       1.27K    2.04 MB       761.00 B  INNER JOIN, PARTITIONED
|--17:EXCHANGE            22    6.449us   14.136us       7         761          0              0  HASH(dd.id)
|  04:SCAN HDFS            1   31.094ms   31.094ms       7         761  175.15 KB       32.00 MB  irdw_prod.date_dim dd
16:EXCHANGE               22  313.646us  762.564us  24.74K       1.27K          0              0  HASH(event_date_local_dim_id)
07:HASH JOIN              22  222.134ms  336.441ms  24.74K       1.27K   12.04 MB        1.71 MB  INNER JOIN, PARTITIONED
|--15:EXCHANGE            22    2.364ms    3.331ms   1.43M       1.43M          0              0  HASH(cld.id)
|  03:SCAN HDFS            2   17.363ms   21.651ms   1.43M       1.43M   11.66 MB       64.00 MB  irdw_prod.client_dim cld
14:EXCHANGE               22  319.401us  541.207us  24.74K       1.27K          0              0  HASH(fact.client_dim_id)
06:HASH JOIN              22  238.946ms  399.160ms  24.74K       1.27K    6.03 MB      428.04 KB  INNER JOIN, PARTITIONED
|--13:EXCHANGE            22    2.509ms    3.938ms   2.19M       2.19M          0              0  HASH(md.id)
|  02:SCAN HDFS            7   14.627ms   28.996ms   2.19M       2.19M    3.27 MB       48.00 MB  irdw_prod.media_dim md
12:EXCHANGE               22  265.672us  600.188us  24.74K       1.27K          0              0  HASH(fact.media_dim_id)
05:HASH JOIN              22  220.025ms  363.591ms  24.74K       1.27K    2.02 MB        18.00 B  INNER JOIN, BROADCAST
|--11:EXCHANGE            22   12.656us   17.408us       2           2          0              0  BROADCAST
|  01:SCAN HDFS            1   10.060ms   10.060ms       2           2  181.48 KB       32.00 MB  irdw_prod.campaign_dim cd
00:SCAN HDFS              22  551.595ms    1s062ms  24.74K       4.26M    2.59 MB      320.00 MB  irdw_prod.agg_daily_activit...

      Ready to start 121 remote fragments: 36,909,268
      All 121 remote fragments started: 6,567,144,968
      First dynamic filter received: 6,567,170,788
      Rows available: 8,395,137,540
Created 11-04-2016 08:31 PM
- Mark as New
- Bookmark
- Subscribe
- Mute
- Subscribe to RSS Feed
- Permalink
- Report Inappropriate Content
I'm not sure where I go from here with this insight though... there are no actual timestamps in the fragments, only individual timings, so no idea how to find out which ones in which nodes started late. Any ideas on that, anyone? thanks, -m
Created 11-07-2016 02:34 PM
- Mark as New
- Bookmark
- Subscribe
- Mute
- Subscribe to RSS Feed
- Permalink
- Report Inappropriate Content
We could definitely improve some of the diagnostics there. My guess is that one node is either overloaded or has some kind of hardware issue - might be worth looking at the health and CPU/memory usage of different nodes to see if one stands out.
Created 11-08-2016 11:04 AM
- Mark as New
- Bookmark
- Subscribe
- Mute
- Subscribe to RSS Feed
- Permalink
- Report Inappropriate Content
Thanks Tim, yeah even just having the real-time start timestamp for each fragment/instance would be very helpful to isolate consistent slow worker nodes. Should I open a JIRA for that?
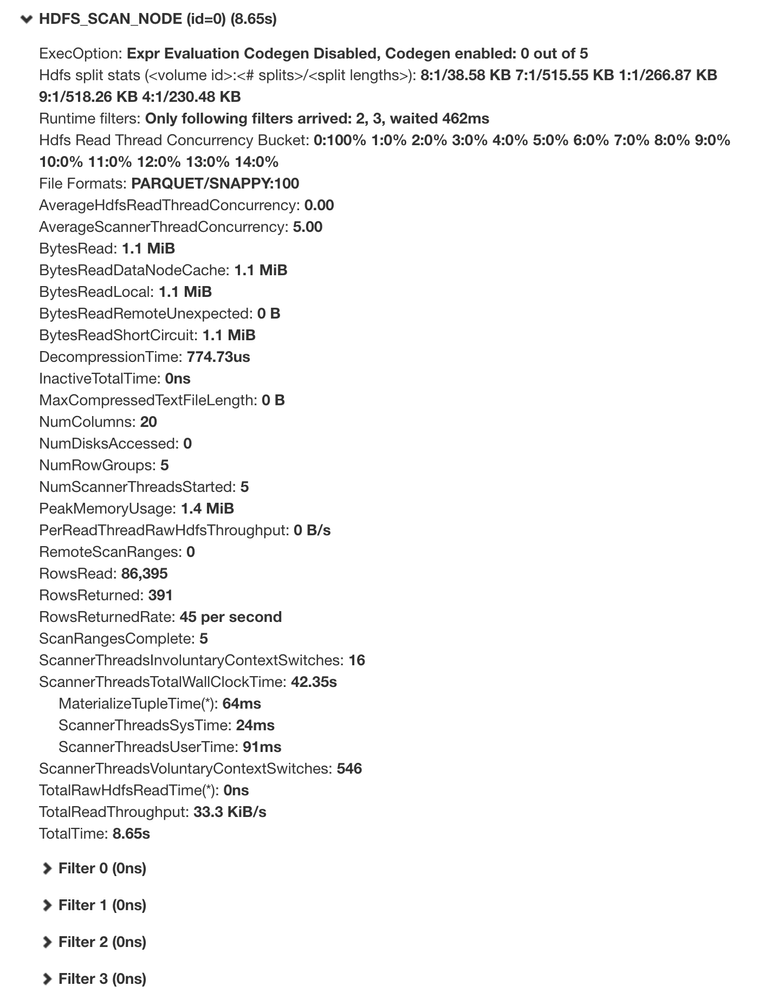
Quick follow up question (last one promise), here's another weird instance of that same query which happens often: relatively small (by comparison) hdfs scan of 1MB and 86K rows, all local, all from cache, and still took 8 seconds vs. about the normal 400ms in all other nodes. Since disk is not a factor here, what else could be holding up the read from cache? cluster is barely loaded at 20% cpu.
Created 11-08-2016 05:24 PM
- Mark as New
- Bookmark
- Subscribe
- Mute
- Subscribe to RSS Feed
- Permalink
- Report Inappropriate Content
Please do open a JIRA - it's always good to have some context on the problem from users.
It looks like the scanners in that profile are just idle (based on the user and system time) - so my guess is that the slowdown is something further up on the plan.
Created 11-15-2016 07:22 PM
- Mark as New
- Bookmark
- Subscribe
- Mute
- Subscribe to RSS Feed
- Permalink
- Report Inappropriate Content
I've opened IMPALA-4492. Thanks Tim. -m


