Support Questions
- Cloudera Community
- Support
- Support Questions
- Re: Hive query running on Tez contains a Mapper th...
- Subscribe to RSS Feed
- Mark Question as New
- Mark Question as Read
- Float this Question for Current User
- Bookmark
- Subscribe
- Mute
- Printer Friendly Page
- Subscribe to RSS Feed
- Mark Question as New
- Mark Question as Read
- Float this Question for Current User
- Bookmark
- Subscribe
- Mute
- Printer Friendly Page
Hive query running on Tez contains a Mapper that has run for hours and hasn't completed..HELP :/
- Labels:
-
Apache Hadoop
-
Apache Hive
-
Apache Tez
Created on 07-12-2016 11:03 AM - edited 08-19-2019 03:10 AM
- Mark as New
- Bookmark
- Subscribe
- Mute
- Subscribe to RSS Feed
- Permalink
- Report Inappropriate Content
Hi All,
I have the following hive query run on Tez/YARN involving two hive tables A and B:
select
      PreQuery.name,
      sum(case when PreQuery.Geode < 10.0 then 1 else 0 end) 10mCount,
      sum(case when PreQuery.Geode < 50.0 then 1 else 0 end) 50mCount,
      sum(case when PreQuery.Geode < 1000.0 then 1 else 0 end) 100mCount
   from
      ( select
              a.name,
              ST_GeodesicLengthWGS84( ST_SetSRID( ST_LineString(a.lat, a.lon, b.lat, b.lon),4326)) as Geode
           from a, b) PreQuery
   GROUP BY
      PreQuery.name
   ORDER by
      1000mCount desc
Table A has 45,000 rows, numFiles=1 as a managed ORC file and totalDataSize=1423246. Table B has 54,000 rows with a totalDataSize=11876624 and numFiles=1 stored as a managed TEXT FILE.
My HDP2.4 cluster has 3 nodes providing a total of 12vCores with a minimum allocation of 256MB (1vCore) and a maximum allocation of 1048MB (4 vCores) YARN container(s). there is no bucketing or partitioning on these tables.
My main Hive/Tez settings are:
yarn.scheduler.minimum-allocation-mb=256MB
yarn.scheduler.maximum-allocation-mb=1048MB
hive.tez.container.size=512MB
hive.tez.java.opts=-server -Djava.net.preferIPv4Stack=true -XX:NewRatio=8 -XX:+UseNUMA -XX:+UseG1GC -XX:+ResizeTLAB -XX:+PrintGCDetails -verbose:gc -XX:+PrintGCTimeStamps
mapreduce.map.memory.mb=256MB
mapreduce.map.java.opts=-Xmx204m
mapreduce.reduce.memory.mb=512MB
mapreduce.reduce.java.opts=-Xmx409m
tez.runtime.io.sort.mb=68MB
hive.auto.convert.sortmerge.join=true
hive.auto.convert.sortmerge.join.to.mapjoin=false
When I run the query I see the following output in the DaG graphical view:
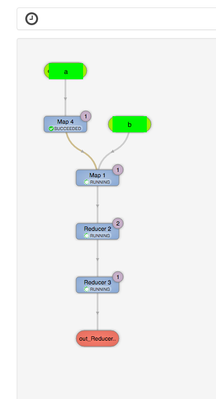
Mapper 4 completes instantly but then Mapper 1 says its running, but its been running for hours and nothing is progressing. The DAG indicates that it is running at 20% with no clear sign of progress.
I'm running through query through the beeline command tool, the latest outputs: "INFO : Map 1: 0(+1)/1Map 4: 1/1Reducer 2: 0/2Reducer 3: 0/1".
Looking at the YARN UI manager the job created only requests 2 containers from the underlying cluster using 512MB of memory per container.
So my general question is how can I optimise this to run faster? Is it an issue with the query itself, the way the tables are setup or is more resource required in the platform.
I feel like given the small volume of data im processing the available resource in the cluster should be more than enough which leads me to believe I'm doing something very wrong or the config is not correct.
Any help much appreciated,
M
Created 07-12-2016 11:13 AM
- Mark as New
- Bookmark
- Subscribe
- Mute
- Subscribe to RSS Feed
- Permalink
- Report Inappropriate Content
"from a, b"
Unless I am mistaken ( I didn't look at it in too much detail ) You are doing a classic mistake. A cartesian join. There is no join condition in your join. So you are creating:
45,000 * 54000 = 2000000000 rows.
This is supposed to take forever. If you want to make this faster you need to join the two tables by a join condition like a key or at the very least restrict the combinations a bit by joining regions with each other.
If you HAVE to compare every row with every row you need to somehow get him to distribute data more. You can decrease the split size for example to make this work on more mappers. Tez has the min and max group size parameters to say how much data there will be in a mapper. You could reduce that to something VERY small to force him to split up the base data set into a couple rows each.
But by and large cartesian joins are just mathematically terrible. You seem to be doing some geodetic stuff so perhaps you could generate a set of overlapping regions in your data set and make sure that you only compare values that are in the same regions there are a couple tricks here.
Edit:
a) If you HAVE to compare all rows with all rows. 2b comparisons are not too much for a cluster. Use the following tez parameters to split up your computations into a lot of small tasks. Per default this is up to a GB but you could force it to 100 kb or so and make sure you get at least 24 mappers or so out of it:
tez.grouping.max-size
tez.grouping.min-size
b) Put a distance function in a join condition where distance < 1000 or so. So you discard all unwanted rows before the shuffle. He still needs to do 2b computations but at least he doesn't need to shuffle 2b rows around.
c) if all of that fails you need to become creative. One thing I have seen for distance functions is to add quadratic regions of double your max. distance length to your data set ( overlapping ) assign them to the regions and only join them if the two points at least belong to one of the regions.
Created 07-12-2016 06:33 PM
- Mark as New
- Bookmark
- Subscribe
- Mute
- Subscribe to RSS Feed
- Permalink
- Report Inappropriate Content
> A cartesian join.
+1, right on.
> still needs to do 2b computations but at least he doesn't need to shuffle 2b rows around.
Even without any modifications, the shuffle won't move 2b rows, it will move exactly 3 aggregates per a.name because the map-side aggregation will fold that away into the sum().
> tez.grouping.max-size
Rather than playing with the split-sizes which are fragile, you can however shuffle the 54,000 row set - the SORT BY can do that more predictably
set hive.exec.reducers.bytes.per.reducer=4096;
select sum() ... (select x.name, <gis-func>() from (select name, lon, lat from a sort by a.name) x, b) y;
I tried it out with a sample query and it works more predictably this way.
hive (tpcds_bin_partitioned_orc_200)> select count(1) from (select d_date, t_time_id from (select d_date from date_dim sort by d_date) d, time_dim) x;
6,311,433,600
Time taken: 20.412 seconds, Fetched: 1 row(s)
hive (tpcds_bin_partitioned_orc_200)>
Created 07-12-2016 11:57 PM
- Mark as New
- Bookmark
- Subscribe
- Mute
- Subscribe to RSS Feed
- Permalink
- Report Inappropriate Content
Good to have the higher power doublecheck 😉 . The sort by is a nice trick will use that from now on. Didn't actually see the sum, I thought he returned a list of close coordinates.
Created 07-15-2016 09:55 AM
- Mark as New
- Bookmark
- Subscribe
- Mute
- Subscribe to RSS Feed
- Permalink
- Report Inappropriate Content
hmmm I think your cluster has bigger problems. It shows that only 2 of the 700 tasks are actually running. How many slots do you have in your cluster? I.e. yarn min/max settings and total memory in cluster? They still shouldn't take so long anymore because they shoiuld only have 1/700 of data but something is just weird. I think you might have to call support.
Created 07-27-2016 11:16 AM
- Mark as New
- Bookmark
- Subscribe
- Mute
- Subscribe to RSS Feed
- Permalink
- Report Inappropriate Content
The cluster is fairly small as its mostly experimental but I have 3 out of the 4 nodes in the cluster that each have 4 vCores and 1GB of memory, with a global YARN minimum memory container size of 256MB. So when you say slots I'm assuming that would translate into 12 slots/containers potentially? i.e. a container representing 1vCore + 256MB. I had assumed that for the resource (CPU/RAM) available in my cluster that the query I'm running on the dataset sizes I'm working with i..e 30-40k records would be more than enough?
Created 07-13-2016 08:55 AM
- Mark as New
- Bookmark
- Subscribe
- Mute
- Subscribe to RSS Feed
- Permalink
- Report Inappropriate Content
Thanks both for your insight- I'm a noob in understanding the implications of a hive query and understanding the way in which mappers and reducers are formed. It the fundamental problem that the tables are in 1 file of relatively small data size, and therefore Tez does not initialise multiple mappers in parallel?
Also could you provide a little more explanation around the use of SORT BY and how this improves performance. I'm planning on running some benchmark tests today to compare processing time.
The job did finally complete in 3 hours 22 minutes 😕
Created 07-13-2016 11:20 AM
- Mark as New
- Bookmark
- Subscribe
- Mute
- Subscribe to RSS Feed
- Permalink
- Report Inappropriate Content
@mike harding yeah the problem is that Tez tries to create an appropriate number of map tasks. Too much is wasteful since there is a lot of overhead, not enough and tasks are slow. Since your data volumes are tiny it creates one task essentially. However since you use a cartesian join and blow up your 50k rows into 2.5 billion computations this is not appropriate in your case. You need at least as many tasks as you have task slots in your cluster to properly utilize your processing.
To increase the number of tasks you have multiple options:
a) My Option with the grouping parameters
You can tell Tez to use more mappers by changing the grouping parameters. (essentially telling tez how much bytes each map task should process) However this is a bit trial and error since you need to specify a byte size for each mapper and in these small data volumes it gets a bit iffy
b) Gopals approach using a reducer
This is more elegant, instead of doing the join in mappers you add a shuffle before and set the number of reducers to the number you want ( gopal used 4096 but your cluster is small so I would use less ). You then add a sub select inside with a sort by essentially forcing a reduce step before your computation. In the end you will have
Map ( 1 ) -> Shuffle -> Reducer ( Sort by 4096 values 0 ) -> your spatial computations. -> Reduce (group by aggregate)
Makes sense?
Created on 07-13-2016 06:45 PM - edited 08-19-2019 03:10 AM
- Mark as New
- Bookmark
- Subscribe
- Mute
- Subscribe to RSS Feed
- Permalink
- Report Inappropriate Content
That all makes sense and I've adjusted the query as suggested. Although, it seems like the delay has now shifted to the reducer. As shown below it now shows reducer 4 processing 700 tasks but has been running for hours and the tez job is using 80% of the cluster capacity.
I'm running a simplified query also to test performance:
SELECT A.name, A.uid FROM (SELECT name, uid, latitude, longitude FROM ATable SORT BY asset_id) A JOIN B WHERE ST_Within(ST_SetSRID(ST_Point(B.longitude, B.latitude),4326), ST_SetSRID(ST_Buffer(ST_Point(A.longitude, A.latitude), 0.0005),4326));
I'm wondering if this is a problem with the spatial functions perhaps?
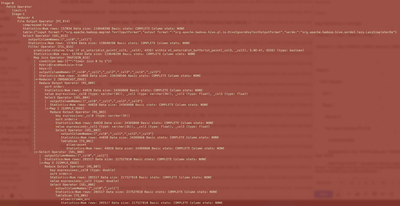
This is the EXPLAIN output of the query:


