Support Questions
- Cloudera Community
- Support
- Support Questions
- Re: How to monitor the actual memory allocation of...
- Subscribe to RSS Feed
- Mark Question as New
- Mark Question as Read
- Float this Question for Current User
- Bookmark
- Subscribe
- Mute
- Printer Friendly Page
- Subscribe to RSS Feed
- Mark Question as New
- Mark Question as Read
- Float this Question for Current User
- Bookmark
- Subscribe
- Mute
- Printer Friendly Page
How to monitor the actual memory allocation of a spark application
- Labels:
-
Apache Atlas
-
Apache Spark
Created 10-26-2018 12:28 PM
- Mark as New
- Bookmark
- Subscribe
- Mute
- Subscribe to RSS Feed
- Permalink
- Report Inappropriate Content
Is there a proper way to monitor the memory usage of a spark application.
By memory usage, i didnt mean the executor memory, that can be set, but the actual memory usage of the application.
Note : We are running Spark on YARN
Created 10-26-2018 12:49 PM
- Mark as New
- Bookmark
- Subscribe
- Mute
- Subscribe to RSS Feed
- Permalink
- Report Inappropriate Content
@Nikhil Have you checked the Executor tab in Spark UI, does this helps? RM UI also displays the total memory per application.
HTH
Created on 10-29-2018 09:39 AM - edited 08-17-2019 04:58 PM
- Mark as New
- Bookmark
- Subscribe
- Mute
- Subscribe to RSS Feed
- Permalink
- Report Inappropriate Content
@Felix Albani ... sorry for the delay in getting back
Spark UI - Checking the spark ui is not practical in our case.
RM UI - Yarn UI seems to display the total memory consumption of spark app that has executors and driver. From this how can we sort out the actual memory usage of executors.
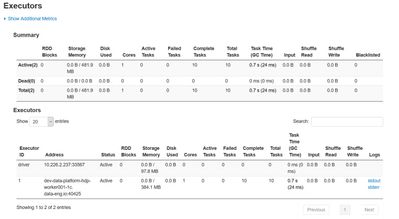
I have ran a sample pi job. Could you please let me know how to get the actual memory consumption of executors
spark-submit --class org.apache.spark.examples.SparkPi --master yarn-client --num-executors 1 --driver-memory 512m --executor-memory 1024m --executor-cores 1 /usr/hdp/2.6.3.0-235/spark2/examples/jars/spark-examples*.jar 10
Application Id : application_1530502574422_0004
Application Stats
{"app":{"id":"application_1530502574422_0004","user":"ec2-user","name":"Spark Pi","queue":"default","state":"FINISHED","finalStatus":"SUCCEEDED","progress":100.0,"trackingUI":"History","trackingUrl":"http://dev-data-platform-hdp-master002-1c.data-eng.io:8088/proxy/application_1530502574422_0004/","diagnostics":"","clusterId":1530502574422,"applicationType":"SPARK","applicationTags":"","priority":0,"startedTime":1540731128244,"finishedTime":1540731139717,"elapsedTime":11473,"amContainerLogs":"http://dev-data-platform-hdp-worker001-1c.data-eng.io:8042/node/containerlogs/container_e28_1530502574422_0004_01_000001/ec2-user","amHostHttpAddress":"dev-data-platform-hdp-worker001-1c.data-eng.io:8042","allocatedMB":-1,"allocatedVCores":-1,"runningContainers":-1,"memorySeconds":21027,"vcoreSeconds":15,"queueUsagePercentage":0.0,"clusterUsagePercentage":0.0,"preemptedResourceMB":0,"preemptedResourceVCores":0,"numNonAMContainerPreempted":0,"numAMContainerPreempted":0,"logAggregationStatus":"SUCCEEDED","unmanagedApplication":false,"amNodeLabelExpression":""}}
Executor details from Spark History Web UI
Created 11-01-2018 07:41 AM
- Mark as New
- Bookmark
- Subscribe
- Mute
- Subscribe to RSS Feed
- Permalink
- Report Inappropriate Content
@Felix Albani...did you had a chance to look into it
Created on 11-01-2018 08:23 AM - edited 08-17-2019 04:58 PM
- Mark as New
- Bookmark
- Subscribe
- Mute
- Subscribe to RSS Feed
- Permalink
- Report Inappropriate Content
Hi @Nikhil
If you want to follow the memory usage of individual executors for spark, one way that is possible is via configuration of the spark metrics properties. I've previously posted the following guide that may help you set this up if this would fit your use case;
I've just whipped up this example chart showing the individual driver & executor total memory usage for a simple spark application;
You can adjust above example according to your need, a total of executors or executors + driver combined, or keep them individual etc...
Created 11-01-2018 08:36 AM
- Mark as New
- Bookmark
- Subscribe
- Mute
- Subscribe to RSS Feed
- Permalink
- Report Inappropriate Content
@Jonathan Sneep...thanks for the input...will check this and let you know
Created 11-01-2018 12:10 PM
- Mark as New
- Bookmark
- Subscribe
- Mute
- Subscribe to RSS Feed
- Permalink
- Report Inappropriate Content
@Jonathan Sneep....is there a proper documention to install and configure graphite on amazon ami ?
Created 11-01-2018 12:15 PM
- Mark as New
- Bookmark
- Subscribe
- Mute
- Subscribe to RSS Feed
- Permalink
- Report Inappropriate Content
Created 11-01-2018 12:26 PM
- Mark as New
- Bookmark
- Subscribe
- Mute
- Subscribe to RSS Feed
- Permalink
- Report Inappropriate Content
@Jonathan Sneep...i already followed that but getting the below error while installing packages
Error: Package: python-django-tagging-0.3.1-7.el6.noarch (epel)
           Requires: Django
 You could try using --skip-broken to work around the problem
Amazon Ami - Amazon Linux AMI 2017.03.1.20170812 x86_64 HVM GP2
Created 11-02-2018 12:17 PM
- Mark as New
- Bookmark
- Subscribe
- Mute
- Subscribe to RSS Feed
- Permalink
- Report Inappropriate Content
@Jonathan Sneep
I have managed to configure and integrate spark app, grafana and graphite.
Could you please let me know on how to configure the metrics to get the graphs of the below :
- HDFS Bytes Read/Written Per Executor
- HDFS Executor Read/Write Bytes/Sec
- Read IOPS
- Task Executor
- Active Tasks per Executor
- Completed Tasks per Executor
- Completed Tasks/Minute per Executor
- Driver Memory
- Driver Heap Usage
- Driver JVM Memory Pools Usage
- Executor Memory Usage
- JVM Heap Usage Per Executor
- Spark Executor and Driver memory used


