
Our Community is getting an upgrade! To get everything ready for the relaunch, we’ll be placing the site in read-only mode starting September 21st.
We really appreciate your understanding while we get things set up behind the scenes. Catch up on all the exciting details about the move here.
Need help or have questions? Drop us a line at [email protected]

Support Questions
 Hi, I'm CLEO! Something exciting is coming to the Community. Stay Tuned!
- Cloudera Community
- Support
- Support Questions
- Re: Interpret 'Cluster CPU' graph from CM
- Subscribe to RSS Feed
- Mark Question as New
- Mark Question as Read
- Float this Question for Current User
- Bookmark
- Subscribe
- Mute
- Printer Friendly Page
- Subscribe to RSS Feed
- Mark Question as New
- Mark Question as Read
- Float this Question for Current User
- Bookmark
- Subscribe
- Mute
- Printer Friendly Page
Interpret 'Cluster CPU' graph from CM
- Labels:
-
Cloudera Manager


Created 11-03-2022 12:27 AM
- Mark as New
- Bookmark
- Subscribe
- Mute
- Subscribe to RSS Feed
- Permalink
- Report Inappropriate Content
Hi Team,
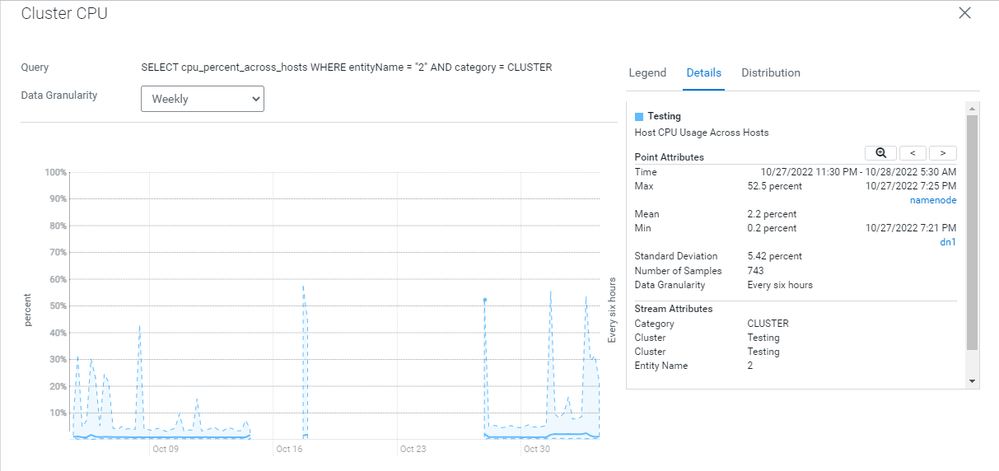
Can you please explain me how to interpret 'Cluster CPU' graph from CM.



Created 11-09-2022 10:53 PM
- Mark as New
- Bookmark
- Subscribe
- Mute
- Subscribe to RSS Feed
- Permalink
- Report Inappropriate Content
Hello @hanumanth
Thanks for using Cloudera Community. Based on the Post & Screenshot shared, the CPU Usage for the concerned Timeframe of (2022-10-27 11:30 PM - 2022-10-28 05:30 AM) was 2.2% as a Mean i.e. Average, considering the samples collected during the concerned period.
Regards, Smarak
Created 11-15-2022 09:11 PM
- Mark as New
- Bookmark
- Subscribe
- Mute
- Subscribe to RSS Feed
- Permalink
- Report Inappropriate Content
Hello @hanumanth
Hope you are doing well. Kindly confirm if your ask has been addressed by our Post dated 2022-11-09. If Yes, Please mark the Post as Solved. If No, Feel free to share any further queries/concerns & we shall respond accordingly.
Regards, Smarak
Created 11-03-2022 12:30 AM
- Mark as New
- Bookmark
- Subscribe
- Mute
- Subscribe to RSS Feed
- Permalink
- Report Inappropriate Content
Created 11-03-2022 12:31 AM
- Mark as New
- Bookmark
- Subscribe
- Mute
- Subscribe to RSS Feed
- Permalink
- Report Inappropriate Content
from above graph can i tell cluster cpu utilization was 2%???
Created 11-09-2022 10:53 PM
- Mark as New
- Bookmark
- Subscribe
- Mute
- Subscribe to RSS Feed
- Permalink
- Report Inappropriate Content
Hello @hanumanth
Thanks for using Cloudera Community. Based on the Post & Screenshot shared, the CPU Usage for the concerned Timeframe of (2022-10-27 11:30 PM - 2022-10-28 05:30 AM) was 2.2% as a Mean i.e. Average, considering the samples collected during the concerned period.
Regards, Smarak
Created 11-15-2022 09:11 PM
- Mark as New
- Bookmark
- Subscribe
- Mute
- Subscribe to RSS Feed
- Permalink
- Report Inappropriate Content
Hello @hanumanth
Hope you are doing well. Kindly confirm if your ask has been addressed by our Post dated 2022-11-09. If Yes, Please mark the Post as Solved. If No, Feel free to share any further queries/concerns & we shall respond accordingly.
Regards, Smarak


