Support Questions
- Cloudera Community
- Support
- Support Questions
- Re: Kafka to Redis - mergeContent queue filling up
- Subscribe to RSS Feed
- Mark Question as New
- Mark Question as Read
- Float this Question for Current User
- Bookmark
- Subscribe
- Mute
- Printer Friendly Page
- Subscribe to RSS Feed
- Mark Question as New
- Mark Question as Read
- Float this Question for Current User
- Bookmark
- Subscribe
- Mute
- Printer Friendly Page
Kafka to Redis - mergeContent queue filling up
- Labels:
-
Apache NiFi
Created 03-26-2024 07:24 AM
- Mark as New
- Bookmark
- Subscribe
- Mute
- Subscribe to RSS Feed
- Permalink
- Report Inappropriate Content
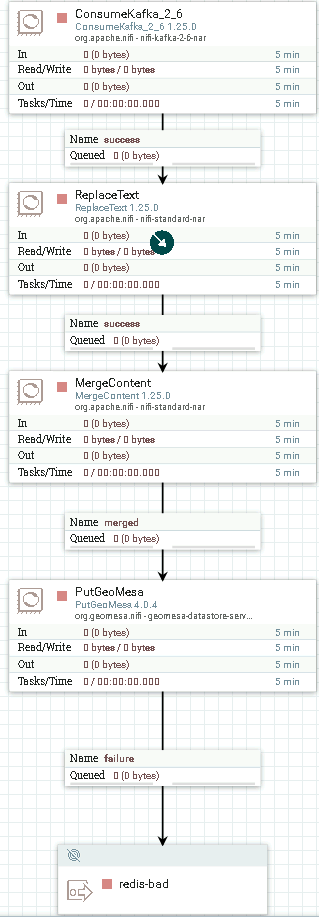
I'm new to NiFi. I have a flow that's consuming messages from Kafka and producing them to Redis. The issue I'm experiencing is the MergedContent queue is filling up within seconds, which is slowing down the process of getting the records into Redis. I'm wondering what the recommended approach is to improve things (being new to Redis, I'm aware that I'm most likely missing some obvious things). My flow looks like this:
Created 03-27-2024 12:30 PM
- Mark as New
- Bookmark
- Subscribe
- Mute
- Subscribe to RSS Feed
- Permalink
- Report Inappropriate Content
@jpalmer From the image you shared the bottleneck is actually in the custom non Apache NiFi out-of the-box PutGeoMesa 4.0.4 processor. A connection has backpressure settings to limit the amount of FlowFiles that can queue be queued (it is a soft limit which means back pressure gets applied once Connection backpressure threshold is reached or exceeded). Once backpressure is applied it will not be release until queue drops back below the configured thresholds. Backpressure when applied prevents the upstream processor from being scheduled to execute until that backpressure is removed. The connection turns red when backpressure is being applied and since the connection after PutGeoMesa 4.0.4 is not red, no backpressure is being applied on that processor. So you issue is the PutGeoMesa 4.0.4 is not able to process the FlowFiles being queued to it fast enough thus causing the backup in every upstream connection leading to the source processor. Since it is a custom processor I can't speak to its performance capabilities or tuning capabilities. I also don't know it the PutGeoMesa 4.0.4 processor will support concurrent executions either, but you could try:
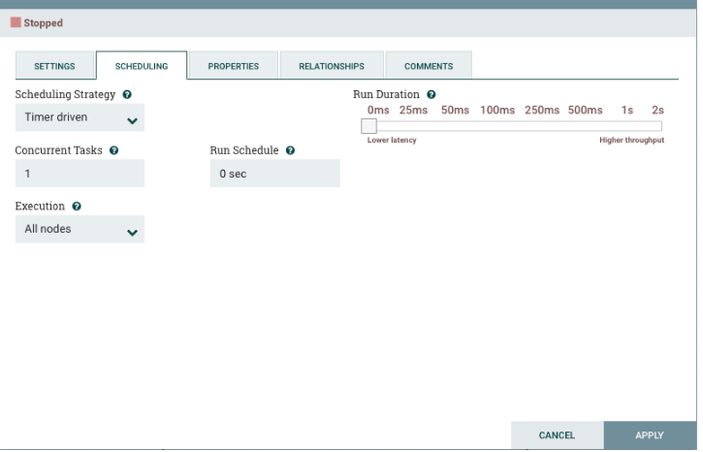
If you right click on the PutGeoMesa 4.0.4 processor and select configure, you can select the SCHEDULING tab.
Within the Scheduling tab you can set "CONCURRENT TASKS". The default is 1 and this custom processor might ignore this property. What concurrent task does is allow the processor execute multiple times concurrently (so think of it as for each additional concurrent task, you are creating another identical processor). A processor component is scheduled to request a thread to execute base on the configured Run Schedule (for Timer Driven Scheduling Strategy the default 0 secs means schedule as fast as possible). So when it is scheduled the processor request a thread from the NiFi Timer Driven thread pool. That thread is then used to execute the processors code against a source connection FlowFile(s). The scheduler will the try to schedule it again based on run schedule and if concurrent task is still set to 1 and the previous execution is still running. it will not execute again until the in use thread finishes. But if you set concurrent tasks to say 3, the processor could potentially execute 3 threads concurrently (each thread working on different FlowFile(s) from source connection). Again I don't know if this custom processor will ignore this property or support it. Nor do I know if this processor was coded in a thread safe manor meaning that concurrent thread executions would not cause issues. so even if this appears to improve throughput, verify your data integrity coming out of the processor.
Also keep in mind that adding concurrent tasks to a processor (especially a processor like this that appears to have long running threads. We can see it only processed 23 FlowFiles using 4.5 minutes of CPU time which is pretty slow) can quickly lead to this processor using all the available threads from the Max Timer Driven Thread pool resulting in other processors appearing to perform slower as they get an available thread to execute less often. You can increase the size of the Max Timer Driven Thread pool from the NiFi global menu in upper right corner, but need to do so carefully while monitoring CPU load average and memory usage as you slowly increase the setting.
If you found any of the suggestions/solutions provided helped you with your issue, please take a moment to login and click "Accept as Solution" on one or more of them that helped.
Thank you,
Matt
Created 03-26-2024 11:53 PM
- Mark as New
- Bookmark
- Subscribe
- Mute
- Subscribe to RSS Feed
- Permalink
- Report Inappropriate Content
@jpalmer, Welcome to our community! To help you get the best possible answer, I have tagged in our NiFi experts @SAMSAL @bbahamondes who may be able to assist you further.
Please feel free to provide any additional information or details about your query, and we hope that you will find a satisfactory solution to your question.
Regards,
Vidya Sargur,Community Manager
Was your question answered? Make sure to mark the answer as the accepted solution.
If you find a reply useful, say thanks by clicking on the thumbs up button.
Learn more about the Cloudera Community:
Created 03-27-2024 06:58 AM
- Mark as New
- Bookmark
- Subscribe
- Mute
- Subscribe to RSS Feed
- Permalink
- Report Inappropriate Content
@jpalmer
We'll need some more details to help here:
1. Is this a standalone single NiFi instance or a NiFi multi-instance cluster setup?
2. How many partitions on your source NiFi Kafka topic?
3. How do you have your MergeContent processor configured?
4. When you say connection quickly fills up, what are the settings on the connection?
5. With your flow running and processing FlowFiles through the dataflow connections, what is the CPU load average. You can find these details from within NiFi's UI from either the cluster UI under global menu in upper right corner or the system diagnostics Ui found in the controller UI also under the global menu.
6. Do you have a lot of other dataflows also running within this same NiFi?
MergeContent can be CPU and Heap memory intensive depending on its configuration
There are likely ways to improve your dataflow once we know the above details.
If you found any of the suggestions/solutions provided helped you with your issue, please take a moment to login and click "Accept as Solution" on one or more of them that helped.
Thank you,
Matt
Created on 03-27-2024 09:36 AM - edited 03-27-2024 09:38 AM
- Mark as New
- Bookmark
- Subscribe
- Mute
- Subscribe to RSS Feed
- Permalink
- Report Inappropriate Content
Hi Matt. Thanks for taking the time to help troubleshoot.
1. Is this a standalone single NiFi instance or a NiFi multi-instance cluster setup? standalone single NiFi instance
2. How many partitions on your source NiFi Kafka topic? 4
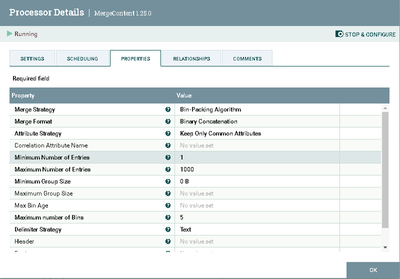
3. How do you have your MergeContent processor configured?
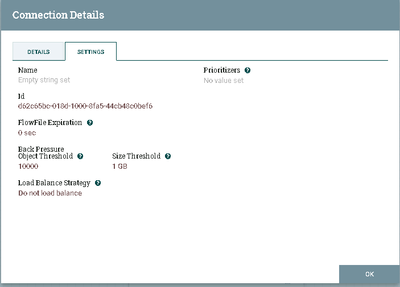
4. When you say connection quickly fills up, what are the settings on the connection?
5. With your flow running and processing FlowFiles through the dataflow connections, what is the CPU load average. You can find these details from within NiFi's UI from either the cluster UI under global menu in upper right corner or the system diagnostics Ui found in the controller UI also under the global menu. I wasn't able to find this menu to get the average.
6. Do you have a lot of other dataflows also running within this same NiFi? this is the only flow.
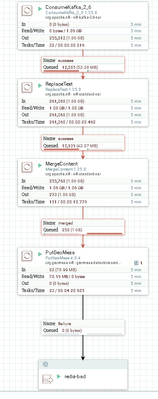
Here's a screenshot of what the flow looks like while running. You can see the merged queue is full, which happens within a few seconds of the application starting.
Created 03-27-2024 12:30 PM
- Mark as New
- Bookmark
- Subscribe
- Mute
- Subscribe to RSS Feed
- Permalink
- Report Inappropriate Content
@jpalmer From the image you shared the bottleneck is actually in the custom non Apache NiFi out-of the-box PutGeoMesa 4.0.4 processor. A connection has backpressure settings to limit the amount of FlowFiles that can queue be queued (it is a soft limit which means back pressure gets applied once Connection backpressure threshold is reached or exceeded). Once backpressure is applied it will not be release until queue drops back below the configured thresholds. Backpressure when applied prevents the upstream processor from being scheduled to execute until that backpressure is removed. The connection turns red when backpressure is being applied and since the connection after PutGeoMesa 4.0.4 is not red, no backpressure is being applied on that processor. So you issue is the PutGeoMesa 4.0.4 is not able to process the FlowFiles being queued to it fast enough thus causing the backup in every upstream connection leading to the source processor. Since it is a custom processor I can't speak to its performance capabilities or tuning capabilities. I also don't know it the PutGeoMesa 4.0.4 processor will support concurrent executions either, but you could try:
If you right click on the PutGeoMesa 4.0.4 processor and select configure, you can select the SCHEDULING tab.
Within the Scheduling tab you can set "CONCURRENT TASKS". The default is 1 and this custom processor might ignore this property. What concurrent task does is allow the processor execute multiple times concurrently (so think of it as for each additional concurrent task, you are creating another identical processor). A processor component is scheduled to request a thread to execute base on the configured Run Schedule (for Timer Driven Scheduling Strategy the default 0 secs means schedule as fast as possible). So when it is scheduled the processor request a thread from the NiFi Timer Driven thread pool. That thread is then used to execute the processors code against a source connection FlowFile(s). The scheduler will the try to schedule it again based on run schedule and if concurrent task is still set to 1 and the previous execution is still running. it will not execute again until the in use thread finishes. But if you set concurrent tasks to say 3, the processor could potentially execute 3 threads concurrently (each thread working on different FlowFile(s) from source connection). Again I don't know if this custom processor will ignore this property or support it. Nor do I know if this processor was coded in a thread safe manor meaning that concurrent thread executions would not cause issues. so even if this appears to improve throughput, verify your data integrity coming out of the processor.
Also keep in mind that adding concurrent tasks to a processor (especially a processor like this that appears to have long running threads. We can see it only processed 23 FlowFiles using 4.5 minutes of CPU time which is pretty slow) can quickly lead to this processor using all the available threads from the Max Timer Driven Thread pool resulting in other processors appearing to perform slower as they get an available thread to execute less often. You can increase the size of the Max Timer Driven Thread pool from the NiFi global menu in upper right corner, but need to do so carefully while monitoring CPU load average and memory usage as you slowly increase the setting.
If you found any of the suggestions/solutions provided helped you with your issue, please take a moment to login and click "Accept as Solution" on one or more of them that helped.
Thank you,
Matt
