Support Questions
- Cloudera Community
- Support
- Support Questions
- Re: Mapreduce job hang, waiting for AM container t...
- Subscribe to RSS Feed
- Mark Question as New
- Mark Question as Read
- Float this Question for Current User
- Bookmark
- Subscribe
- Mute
- Printer Friendly Page
- Subscribe to RSS Feed
- Mark Question as New
- Mark Question as Read
- Float this Question for Current User
- Bookmark
- Subscribe
- Mute
- Printer Friendly Page
Mapreduce job hang, waiting for AM container to be allocated.
- Labels:
-
Apache Hadoop
-
Apache YARN
Created on 04-13-2016 12:59 PM - edited 08-18-2019 04:04 AM
- Mark as New
- Bookmark
- Subscribe
- Mute
- Subscribe to RSS Feed
- Permalink
- Report Inappropriate Content
Hi Team,
Job hang while importing tables via sqoop shown following message in web UI.
ACCEPTED: waiting for AM container to be allocated, launched and register with RM
Kindly suggest.
Created 04-13-2016 06:23 PM
- Mark as New
- Bookmark
- Subscribe
- Mute
- Subscribe to RSS Feed
- Permalink
- Report Inappropriate Content
There are 2 unhealthy nodes, if you click on "2" under unhealthy nodes section, you will get reason why they are unhealthy, it could be because of bad disk etc. Please check and try to check nodemanager's logs, you will get more info in there.
Created 04-13-2016 01:04 PM
- Mark as New
- Bookmark
- Subscribe
- Mute
- Subscribe to RSS Feed
- Permalink
- Report Inappropriate Content
Hi, Nilesh. Have you checked the yarn scheduler? Is the default queue out of resource?
Created 04-13-2016 01:10 PM
- Mark as New
- Bookmark
- Subscribe
- Mute
- Subscribe to RSS Feed
- Permalink
- Report Inappropriate Content
I will suggest yo revisit your yarn memory configuration once. Seems you might be running out of memory.
Can you please let me know what values you have set for yarn.scheduler.capacity.maximum-am-resource-percent ?
If possible please attach -
1. Yarn RM UI snap
2. yarn-site.xml
3. mapred-site.xml
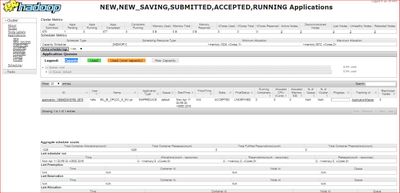
4. Scheduler snap from RM UI -
Created on 04-13-2016 02:36 PM - edited 08-18-2019 04:04 AM
- Mark as New
- Bookmark
- Subscribe
- Mute
- Subscribe to RSS Feed
- Permalink
- Report Inappropriate Content
yarn.scheduler.capacity.maximum-am-resource-percent=0.2
Kindly find attached file for reference.
Created 04-13-2016 02:56 PM
- Mark as New
- Bookmark
- Subscribe
- Mute
- Subscribe to RSS Feed
- Permalink
- Report Inappropriate Content
@Nilesh From the resource manager UI i see there are no "Active Nodes" running and hence the "Total Memory" in UI is displaying 0.
Can you check if your node managers are UP and communicating to RM.
Created 04-13-2016 06:23 PM
- Mark as New
- Bookmark
- Subscribe
- Mute
- Subscribe to RSS Feed
- Permalink
- Report Inappropriate Content
There are 2 unhealthy nodes, if you click on "2" under unhealthy nodes section, you will get reason why they are unhealthy, it could be because of bad disk etc. Please check and try to check nodemanager's logs, you will get more info in there.
Created 04-14-2016 06:33 AM
- Mark as New
- Bookmark
- Subscribe
- Mute
- Subscribe to RSS Feed
- Permalink
- Report Inappropriate Content
@Kuldeep Kulkarni and @Sagar Shimpi
Issue has been resolved by changing below parameter in yarn-site.xml
yarn.nodemanager.disk-health-checker.max-disk-utilization-per-disk-percentage
Previously it was 90% I changed it to 99 Now Job is in running state.
Could you please shed some light on this parameter.
Created 04-14-2016 06:48 AM
- Mark as New
- Bookmark
- Subscribe
- Mute
- Subscribe to RSS Feed
- Permalink
- Report Inappropriate Content
@Nilesh -
yarn.nodemanager.disk-health-checker.max-disk-utilization-per-disk-percentage
The maximum percentage of disk space utilization allowed after which a disk is marked as bad. Values can range from 0.0 to 100.0. If the value is greater than or equal to 100, the nodemanager will check for full disk. This applies to yarn-nodemanager.local-dirs and yarn.nodemanager.log-dirs.
Created 04-14-2016 07:01 AM
- Mark as New
- Bookmark
- Subscribe
- Mute
- Subscribe to RSS Feed
- Permalink
- Report Inappropriate Content
How to find which disk is marked as bad?
Created on 04-14-2016 07:26 AM - edited 08-18-2019 04:04 AM
- Mark as New
- Bookmark
- Subscribe
- Mute
- Subscribe to RSS Feed
- Permalink
- Report Inappropriate Content
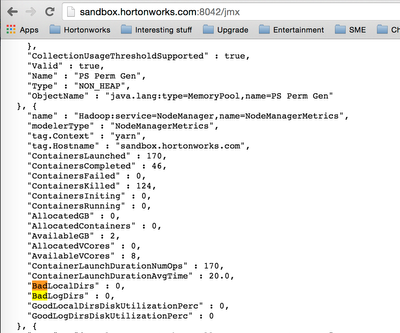
Generally it should be visible on RM UI once you click on the unhealthy nodes.
OR
You can go the unhealthy node(http://<unhealthy-node-manager>:8042/jmx) and check JMX


