Support Questions
- Cloudera Community
- Support
- Support Questions
- Re: Memory Utilization is high unable to find what...
- Subscribe to RSS Feed
- Mark Question as New
- Mark Question as Read
- Float this Question for Current User
- Bookmark
- Subscribe
- Mute
- Printer Friendly Page
- Subscribe to RSS Feed
- Mark Question as New
- Mark Question as Read
- Float this Question for Current User
- Bookmark
- Subscribe
- Mute
- Printer Friendly Page
Memory Utilization is high unable to find what causing this
- Labels:
-
Apache Spark
Created on 10-30-2017 04:19 PM - edited 08-18-2019 02:45 AM
- Mark as New
- Bookmark
- Subscribe
- Mute
- Subscribe to RSS Feed
- Permalink
- Report Inappropriate Content
Created 10-30-2017 04:29 PM
- Mark as New
- Bookmark
- Subscribe
- Mute
- Subscribe to RSS Feed
- Permalink
- Report Inappropriate Content
Hi @deepak rathod Click on the Scheduler link on the Resource Manager page. It will tell you what is the resource utilization for each queue and and you can drill down to identify which jobs are consuming total of 279 containers ? Appears that you have 279 containers running with avg. of 12 GB , with total of 3.41 TB memory reserved.
Created 10-30-2017 04:50 PM
- Mark as New
- Bookmark
- Subscribe
- Mute
- Subscribe to RSS Feed
- Permalink
- Report Inappropriate Content
Hi @Saumil Mayani i found jobs their container comsumption but unable to drill down to see the memory used by each job. is there any way to drill down to memory consumption level?
Created on 10-30-2017 06:14 PM - edited 08-18-2019 02:45 AM
- Mark as New
- Bookmark
- Subscribe
- Mute
- Subscribe to RSS Feed
- Permalink
- Report Inappropriate Content
Hi @deepak rathod Could you please share the screen capture of the scheduler page. It should have for each application, Allocated Memory and vCores, allong with Running Containers. you can sort and see which application has the most Allocated Memory MB. Sample attached.
Created on 10-30-2017 06:29 PM - edited 08-18-2019 02:44 AM
- Mark as New
- Bookmark
- Subscribe
- Mute
- Subscribe to RSS Feed
- Permalink
- Report Inappropriate Content
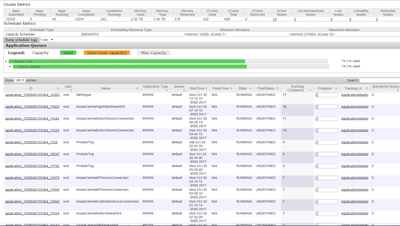
This is my scheduler @Saumil Mayani
Created 10-30-2017 06:35 PM
- Mark as New
- Bookmark
- Subscribe
- Mute
- Subscribe to RSS Feed
- Permalink
- Report Inappropriate Content
Hi @deepak rathod appears that the hdp version you are running, does not have this information on YARN Resource Manager UI. Sample screenshot I attached earlier was from HDP-2.6.2.0-205. You may need to upgrade HDP stack.
Created 10-30-2017 07:03 PM
- Mark as New
- Bookmark
- Subscribe
- Mute
- Subscribe to RSS Feed
- Permalink
- Report Inappropriate Content
@Saumil Mayani but my version is Hadoop 2.7.1.2.3.2.0-2950
Created 10-30-2017 07:07 PM
- Mark as New
- Bookmark
- Subscribe
- Mute
- Subscribe to RSS Feed
- Permalink
- Report Inappropriate Content
Hi @deepak rathod yes, you are using HDP-2.3.2.0. You need to upgrade to HDP-2.6.2.0.
Here is the doc:
https://docs.hortonworks.com/HDPDocuments/HDP2/HDP-2.6.2/index.html


