Support Questions
- Cloudera Community
- Support
- Support Questions
- Re: Metron - Elasticseach service unavailable (mes...
- Subscribe to RSS Feed
- Mark Question as New
- Mark Question as Read
- Float this Question for Current User
- Bookmark
- Subscribe
- Mute
- Printer Friendly Page
- Subscribe to RSS Feed
- Mark Question as New
- Mark Question as Read
- Float this Question for Current User
- Bookmark
- Subscribe
- Mute
- Printer Friendly Page
Metron - Elasticseach service unavailable (message in Kibana)
- Labels:
-
Apache Metron
Created on 07-13-2017 09:05 AM - edited 08-18-2019 01:23 AM
- Mark as New
- Bookmark
- Subscribe
- Mute
- Subscribe to RSS Feed
- Permalink
- Report Inappropriate Content
I would to ask you support for an installation of HCP that we are testing.
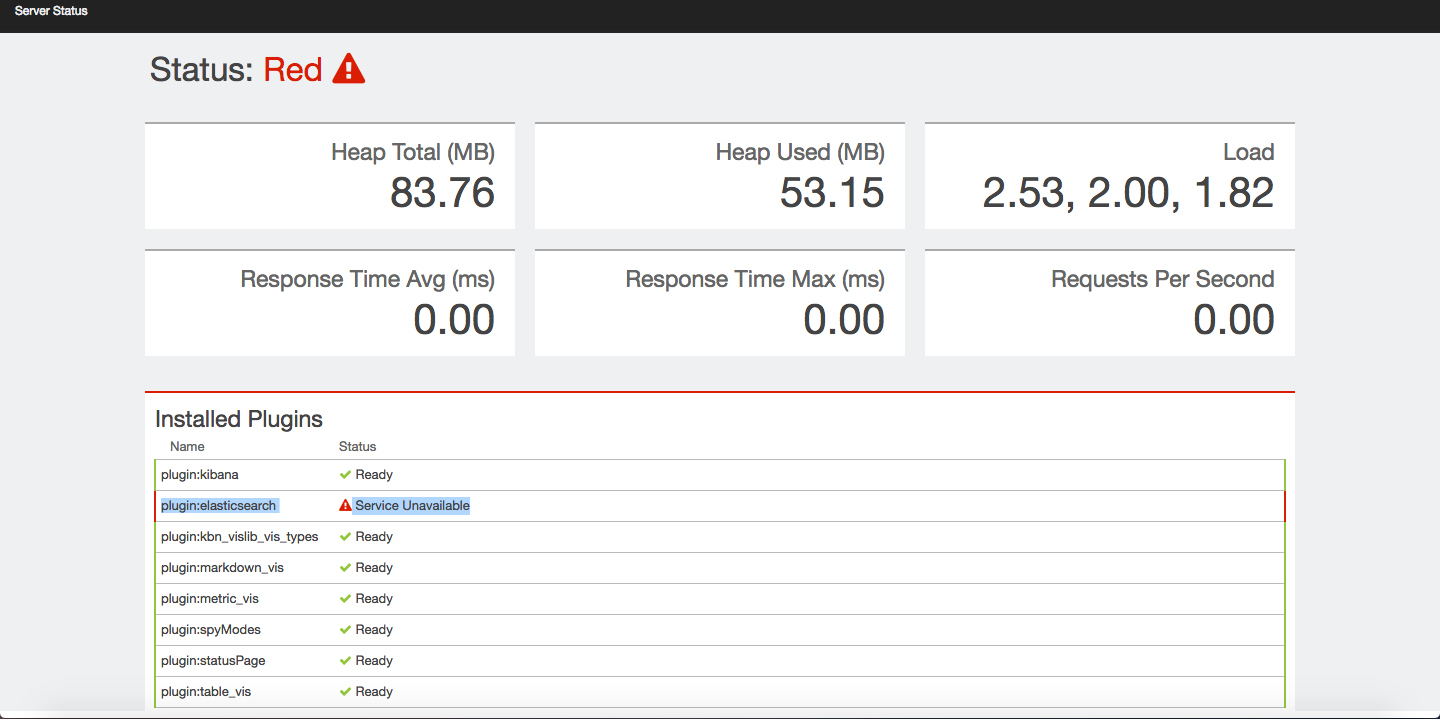
We follow the installation guide of HCP (Metron) on the doc of Hortonworks website. When we try to access the kibana web interface I got the message “plugin elasticsearch: service unavailable”.
On the ambari side everthing is fine.

The strange thing is that if I do a curl cmd to the elasticsearch master I got this reply, so I assume that the elasticsearch works correctly.

Do you have any idea how to handle this issue? Where should we have a look? (log, config, etc..)
Thanks,
Michel
Created 07-13-2017 12:52 PM
- Mark as New
- Bookmark
- Subscribe
- Mute
- Subscribe to RSS Feed
- Permalink
- Report Inappropriate Content
The problem has been solve by changing the parameters in ambari=> elasticsearch : - expected_data_nodes with the good number of datanodes
- gateway_recover_after_data_nodes . with the good number
Created 07-13-2017 10:18 PM
- Mark as New
- Bookmark
- Subscribe
- Mute
- Subscribe to RSS Feed
- Permalink
- Report Inappropriate Content
@msumbul What is the good number for expected_data_nodes? i have the same issue running on single node
Created 08-01-2018 11:19 AM
- Mark as New
- Bookmark
- Subscribe
- Mute
- Subscribe to RSS Feed
- Permalink
- Report Inappropriate Content
I have 1 master node, and 2 data nodes my settings are:
expected_data_nodes: 0
gateway_recover_after_data_nodes: 1
Created 07-22-2017 06:22 AM
- Mark as New
- Bookmark
- Subscribe
- Mute
- Subscribe to RSS Feed
- Permalink
- Report Inappropriate Content
I have tried this but its not working properly. Please tell me how should I resolve this problemscreen-shot-2017-07-22-at-113957-am.png
Created 01-03-2018 08:47 AM
- Mark as New
- Bookmark
- Subscribe
- Mute
- Subscribe to RSS Feed
- Permalink
- Report Inappropriate Content
is there any update for this.i have same problem
regards
Created 08-01-2018 04:12 AM
- Mark as New
- Bookmark
- Subscribe
- Mute
- Subscribe to RSS Feed
- Permalink
- Report Inappropriate Content
I have the same problem 😞 is there any one resolve this problem
,i have same problem 😞 is there any one resolve this problem
Created 08-01-2018 11:22 AM
- Mark as New
- Bookmark
- Subscribe
- Mute
- Subscribe to RSS Feed
- Permalink
- Report Inappropriate Content
see my Answer below.
Created 08-01-2018 11:31 AM
- Mark as New
- Bookmark
- Subscribe
- Mute
- Subscribe to RSS Feed
- Permalink
- Report Inappropriate Content
To properly troubleshoot elasticsearch you first need to make sure that elasticsearch is actually running correctly. Go to QuickLinks and open Elasticsearch Health. Status must be green. Tail your elasticsearch master node log file while restarting to see if there are any issues:
tail -f /var/log/elasticsearch/elasticsearch.log
Additionally you can edit /etc/elasticsearch/log4j2.properties and set logger.action.level to debug for more verbose logging.
Based on the log output, you will likely need to adjust config settings in Advanced elastic-site from Ambari.
Here are my settings for a Master Node + 2 Data Nodes:
bootstrap_memory_lock true
cluster_name elasticsearch
cluster_routing_allocation_disk_threshold_enabled true
cluster_routing_allocation_disk_watermark_high 0.99
cluster_routing_allocation_disk_watermark_low .97
cluster_routing_allocation_node_concurrent_recoveries 4
discovery_zen_fd_ping_interval 15s
discovery_zen_fd_ping_retries 5
discovery_zen_fd_ping_timeout 60s
discovery_zen_ping_timeout 3s
expected_data_nodes 0
gateway_recover_after_data_nodes 1
http_cors_enabled "true"
http_port 9200
index_merge_scheduler_max_thread_count 5
index_number_of_replicas 2
index_number_of_shards 4
index_refresh_interval 1s
index_translog_flush_threshold_size 5g
indices_cluster_send_refresh_mapping false
indices_fielddata_cache_size 25%
indices_memory_index_buffer_size 10%
indices_memory_index_store_throttle_type none
masters_also_are_datanodes "true"
network_host [ 0.0.0.0 ]
network_publish_host []
path_data "/hadoop/elasticsearch/es_data"
recover_after_time 15m
threadpool_bulk_queue_size 3000
threadpool_index_queue_size 1000
transport_tcp_port 9300
zen_discovery_ping_unicast_hosts [ "fqdn.hostname1.com", "fqdn.hostname2.com", "fqdn.hostname3.com" ]

