Support Questions
- Cloudera Community
- Support
- Support Questions
- NiFi - Flow file stuck in queue
- Subscribe to RSS Feed
- Mark Question as New
- Mark Question as Read
- Float this Question for Current User
- Bookmark
- Subscribe
- Mute
- Printer Friendly Page
- Subscribe to RSS Feed
- Mark Question as New
- Mark Question as Read
- Float this Question for Current User
- Bookmark
- Subscribe
- Mute
- Printer Friendly Page
NiFi - Flow file stuck in queue
- Labels:
-
Apache NiFi
Created on 08-02-2023 02:20 AM - edited 08-02-2023 02:54 AM
- Mark as New
- Bookmark
- Subscribe
- Mute
- Subscribe to RSS Feed
- Permalink
- Report Inappropriate Content
In Apache NiFi, the flow file got stuck permanently in queue when the downstream processor has some errors.
I am looking to route the flow file to failure relationship so that I can handle the failure and extract the failure log. But in some cases the flow file got stuck in queue permanently which makes routing to failure relationship impossible.
Is there a way to resolve the issue of flow file getting stuck? If not, is there a way to get notified that a particular flow file waits in which queue and which downstream processor in the processor group has error, so that I can track the failure?
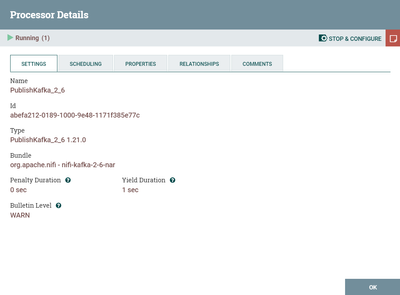
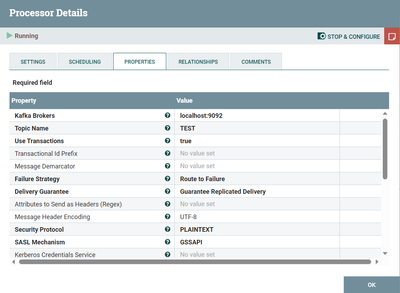
Downstream processor's settings and configuration:
Note: Nifi is the part of the application we use to process files. We are looking for handling failure in Nifi processors without explicitly visiting NiFi UI every time (Getting to know about failures in NiFi processors from the system instead of visiting NiFi UI ). In the case mentioned above, it is impossible to route to failure relationship.
Created 08-02-2023 05:14 AM
- Mark as New
- Bookmark
- Subscribe
- Mute
- Subscribe to RSS Feed
- Permalink
- Report Inappropriate Content
@apk132, Welcome to our community! To help you get the best possible answer, I have tagged our NiFi experts @MattWho @steven-matison @ckumar @cotopaul @SAMSAL who may be able to assist you further.
Please feel free to provide any additional information or details about your query, and we hope that you will find a satisfactory solution to your question.
Regards,
Vidya Sargur,Community Manager
Was your question answered? Make sure to mark the answer as the accepted solution.
If you find a reply useful, say thanks by clicking on the thumbs up button.
Learn more about the Cloudera Community:
Created 08-02-2023 11:53 AM
- Mark as New
- Bookmark
- Subscribe
- Mute
- Subscribe to RSS Feed
- Permalink
- Report Inappropriate Content
@apk132
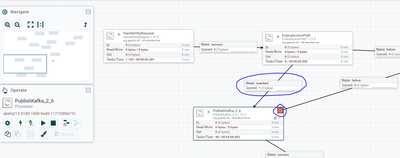
What the first image you shared tells me is that your PublishKafka_2_6 processor received 3 FlowFile on its inbound connection. Two of those were processed (at least one of those two resulted in an error triggering the red bulletin in upper right corner of the processor). The third FlowFile is still associated to a running thread on the processor (indicated by the small "1" in the upper right corner or the processor) The stats show that 48 tasks successfully completed in the past 5 minutes yet you are saying this one FlowFile has been stuck that entire time? How has the processor been scheduled?
Is this a multi-node NiFi cluster? Are the FlowFiles that are successfully processed being processed on a different node than the hung FlowFile is queued?
When it comes to what appears to be a hung thread, getting a series of thread dumps of NIFi JVM spaced apart by 1 min or more can be useful for analysis. You'll be looking to see if this thread stack is progressing or always showing exact same stack. If it is changing then thread is not hung, but rather just long running. If it is not changing, closure examination of the thread stack would help determine what that thread is waiting on.
If you found that the provided solution(s) assisted you with your query, please take a moment to login and click Accept as Solution below each response that helped.
Thank you,
Matt
Created 08-02-2023 11:20 PM
- Mark as New
- Bookmark
- Subscribe
- Mute
- Subscribe to RSS Feed
- Permalink
- Report Inappropriate Content
Hi Matt. Thank you for the reply.
Actually as per the first image I attached, what I did was initiating a single flow file into the flow through Handle Http request processor by hitting an API only once. The initiated flow file got stuck in queue before the PublishKakfa_2_6 processor. What I tried is to route the flow file initiated to failure relationship so as get track of the failure. But it's not routed. So my question is whether there is a way to route the flow file to failure relationship without the flow file being stuck in queue?
Note: I intentionally gave the Publishkafka_2_6 processor's credentials wrong so that I can able to reproduce this scenario.
Created 08-04-2023 01:47 PM
- Mark as New
- Bookmark
- Subscribe
- Mute
- Subscribe to RSS Feed
- Permalink
- Report Inappropriate Content
@apk132
I see in your latest image that the PublishKafka_2_6 has successfully completed 21 tasks/thread in the last 5 minutes. I also see a red bulletin on the processor. What is the exception being seen? It looks like it may not be a hung thread? and perhaps a session rollback is happening instead of routing to failure. That may be how some types of exceptions are handled by this processor even though you have configured the Failure Strategy as "Route to Failure" for "Route On Failure".
Matt
Created 08-06-2023 11:40 PM
- Mark as New
- Bookmark
- Subscribe
- Mute
- Subscribe to RSS Feed
- Permalink
- Report Inappropriate Content
Thank you Matt for the reply. I also thought the same that may be some types of exceptions in the processor are handled in such a way that it cannot be routed to failure relationship.
Created 08-07-2023 10:55 AM
- Mark as New
- Bookmark
- Subscribe
- Mute
- Subscribe to RSS Feed
- Permalink
- Report Inappropriate Content
@apk132
What is the full exception you are seeing so maybe i can dig deeper as to why that specific exception is not routing to failure?
Matt
Created 08-07-2023 09:46 PM
- Mark as New
- Bookmark
- Subscribe
- Mute
- Subscribe to RSS Feed
- Permalink
- Report Inappropriate Content
Hi Matt. The exception I am getting in PublishKafka 2_6 is,
Created 08-04-2023 03:09 PM
- Mark as New
- Bookmark
- Subscribe
- Mute
- Subscribe to RSS Feed
- Permalink
- Report Inappropriate Content
@apk132 I had something like this recently, but it was a result of a configuration error on the processor itself, and not anything to do with the flowfile. Are you able to post the contents of the bulletin from the Bulletin Board screen?
Created 08-06-2023 11:48 PM
- Mark as New
- Bookmark
- Subscribe
- Mute
- Subscribe to RSS Feed
- Permalink
- Report Inappropriate Content
Hi kellerj. Yes it was due to the configuration error on the processor and I was able to see the bulletin corresponding to that on the bulletin board. The intention here is to route to failure relationship incase of any failure so that I can extract the bulletin message and send to the system so that I can track it outside of Nifi.


