Support Questions
- Cloudera Community
- Support
- Support Questions
- Re: ResourceManager Web UI is unreachable alert ev...
- Subscribe to RSS Feed
- Mark Question as New
- Mark Question as Read
- Float this Question for Current User
- Bookmark
- Subscribe
- Mute
- Printer Friendly Page
- Subscribe to RSS Feed
- Mark Question as New
- Mark Question as Read
- Float this Question for Current User
- Bookmark
- Subscribe
- Mute
- Printer Friendly Page
ResourceManager Web UI is unreachable alert eventhough we are to able access RM web UI.
- Labels:
-
Apache YARN
Created 08-10-2017 12:17 PM
- Mark as New
- Bookmark
- Subscribe
- Mute
- Subscribe to RSS Feed
- Permalink
- Report Inappropriate Content
We are getting the altert with the following response details. Even though the web UI is working accessible. I am using HDP 2.5. Please help me to resolved the altert.
HTTP 401 response from http://xxxxxxxxnnnn.aaaa.bbb..corpintra.net:8088 in 0.000s ( % Total % Received % Xferd Average Speed Time Time Time Current Dload Upload Total Spent Left Speed 0 0 0 0 0 0 0 0 --:--:-- --:--:-- --:--:-- 0 0 43 0 43 0 0 16468 0 --:--:-- --:--:-- --:--:-- 43000 0 0 0 0 0 0 0 0 --:--:-- --:--:-- --:--:-- 0 100 1400 100 1400 0 0 179k 0 --:--:-- --:--:-- --:--:-- 179k 100 1400 100 1400 0 0 156k 0 --:--:-- --:--:-- --:--:-- 156k)
Created 08-10-2017 12:37 PM
- Mark as New
- Bookmark
- Subscribe
- Mute
- Subscribe to RSS Feed
- Permalink
- Report Inappropriate Content
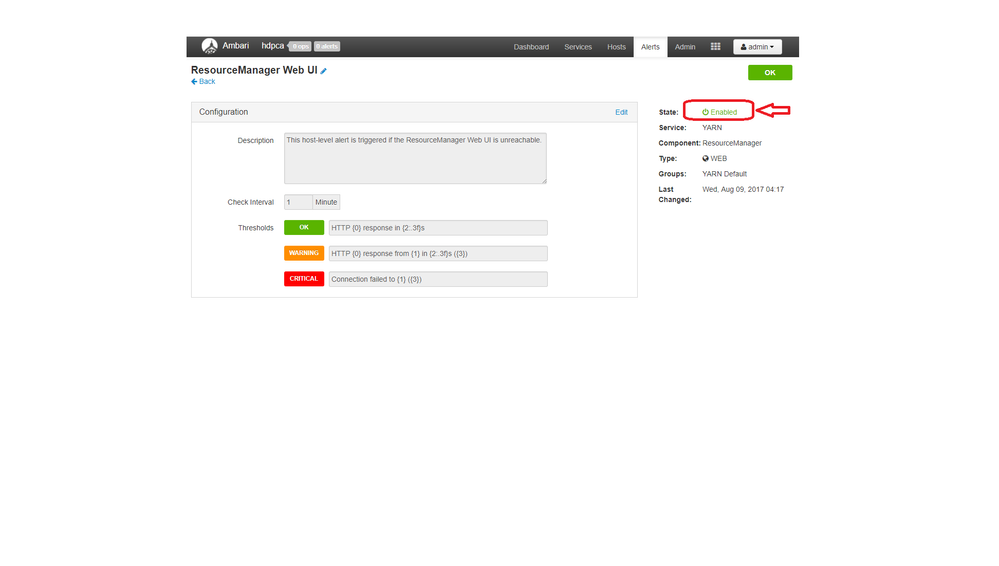
How long have you bee receiving the alerts? Please try to clear the alert be deactivating and activating see attached screenshot

Created 08-10-2017 03:45 PM
- Mark as New
- Bookmark
- Subscribe
- Mute
- Subscribe to RSS Feed
- Permalink
- Report Inappropriate Content
I am facing this issue since last two days. I have deactivated and activated the state of this alert. But no luck. The alert is triggered after couple of minutes. Please help me.
Created 08-10-2017 07:04 PM
- Mark as New
- Bookmark
- Subscribe
- Mute
- Subscribe to RSS Feed
- Permalink
- Report Inappropriate Content
@Narasimha K from the resource manager can you please check if there is any old process of RM is hanging around? you can find it using :
jps -l | grep -i resourcemanager
if you see multiple processes running then you need to kill the old process that is hanging around.
Thanks
Venkat
Created 08-11-2017 06:30 AM
- Mark as New
- Bookmark
- Subscribe
- Mute
- Subscribe to RSS Feed
- Permalink
- Report Inappropriate Content
@Venkat,
I have already checked . Only one RM process is running. Please help me any other ideas to resolve this issue.
root@xxxxxxxxxnnnn:/root : jps -l | grep -i resourcemanager
11550 org.apache.hadoop.yarn.server.resourcemanager.ResourceManager
Created 08-11-2017 07:14 AM
- Mark as New
- Bookmark
- Subscribe
- Mute
- Subscribe to RSS Feed
- Permalink
- Report Inappropriate Content
@Narasimha K , 401 error seems to be related to authentication. Is ResourceManager Web UI requires authentication ? Can you try to check from log who is trying to access ResourceManger web UI ?
Regards,
Fahim
Created 08-11-2017 07:50 AM
- Mark as New
- Bookmark
- Subscribe
- Mute
- Subscribe to RSS Feed
- Permalink
- Report Inappropriate Content
can you please check from the Ambari Alerts if this is coming up as a Stale alert? it could have been hanging around, you can try to delete the alerts from the Ambari DB and see if this alert is coming up if not the issue is resolved and it could happen if there are any changes in the hostname's/ip's or it is not able to find the process that triggered this alert.
please let me know how it gives after fixing it from the DB.
Thanks
Venkat
Created 08-11-2017 10:35 AM
- Mark as New
- Bookmark
- Subscribe
- Mute
- Subscribe to RSS Feed
- Permalink
- Report Inappropriate Content
@Venkat,
I have delete the alert from ambari.alert_current table. But this alert row is created after couple of minutes and the alert is present on the ambari. Please help me any other ideas to resolve this issue.
Thanks
Narasimha k.
Created 08-11-2017 12:09 PM
- Mark as New
- Bookmark
- Subscribe
- Mute
- Subscribe to RSS Feed
- Permalink
- Report Inappropriate Content
@Venkat,
I have delete the alert from ambari.alert_current table. But this alert row is created after couple of minutes and the alert is present on the ambari. Please help me any other ideas to resolve this issue.
Thanks
Narasimha k.
Created 03-12-2018 11:02 PM
- Mark as New
- Bookmark
- Subscribe
- Mute
- Subscribe to RSS Feed
- Permalink
- Report Inappropriate Content
Recently ran into same issue where we were getting alerts for all the UIs. The root cause ended up being the times on the nodes were not correct. After fixing the time and restarting ambari server/agents and all services, the alerts went away

