Support Questions
- Cloudera Community
- Support
- Support Questions
- Re: Unable to issue query: could not connect to th...
- Subscribe to RSS Feed
- Mark Question as New
- Mark Question as Read
- Float this Question for Current User
- Bookmark
- Subscribe
- Mute
- Printer Friendly Page
- Subscribe to RSS Feed
- Mark Question as New
- Mark Question as Read
- Float this Question for Current User
- Bookmark
- Subscribe
- Mute
- Printer Friendly Page
Unable to issue query: could not connect to the Host Monitor
- Labels:
-
Cloudera Manager
Created 04-01-2021 12:52 AM
- Mark as New
- Bookmark
- Subscribe
- Mute
- Subscribe to RSS Feed
- Permalink
- Report Inappropriate Content
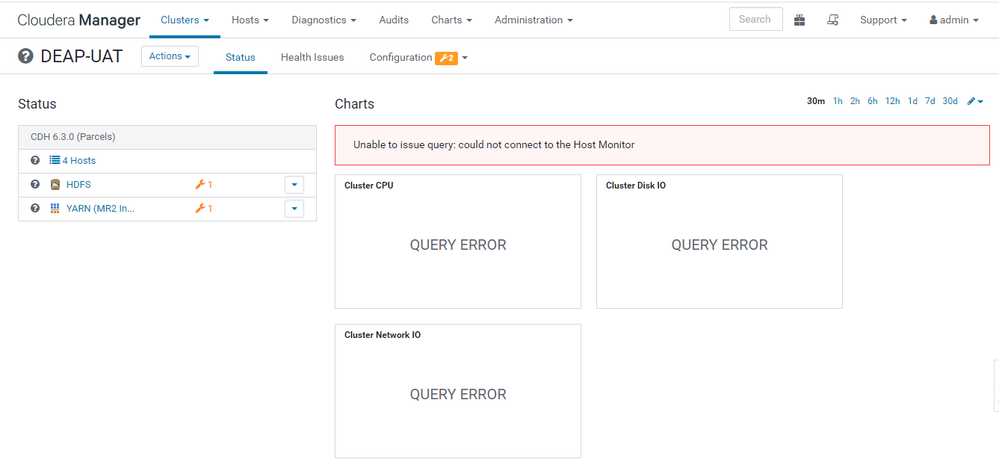
I am getting the error as 'Unable to issue query: could not connect to the Host Monitor'.
I have installed Cloudera manager 6.3 Express version. When checked for the error, I got to know that we require Cloudera Management service to connect to Host monitor. However, I am not getting the option on UI. Can you please suggest. Is it not available for Cloudera Express version?
Attached is the screenshot.
Created 04-01-2021 01:10 AM
- Mark as New
- Bookmark
- Subscribe
- Mute
- Subscribe to RSS Feed
- Permalink
- Report Inappropriate Content
@swapko
That's bizarre can you share your step? and source of download?
Created 04-06-2021 03:25 AM
- Mark as New
- Bookmark
- Subscribe
- Mute
- Subscribe to RSS Feed
- Permalink
- Report Inappropriate Content
We installed it using our organization's internal artifact repository. We have followed the steps given on below:
https://docs.cloudera.com/documentation/enterprise/latest/topics/installation.html
And have setup TLS manually using for Express version: https://docs.cloudera.com/documentation/enterprise/latest/topics/how_to_configure_cm_tls.html
What is required to get the cloudera management service
Created 04-07-2021 01:40 AM
- Mark as New
- Bookmark
- Subscribe
- Mute
- Subscribe to RSS Feed
- Permalink
- Report Inappropriate Content
Just to add on, we could see below in our cloudera server logs:
2021-04-06 17:33:40,983 WARN DataArchiver-24:com.cloudera.server.cmf.tsquery.TimeSeriesQueryService: (302 skipped) Could not find a HOST_MONITORING nozzle from SCM.
com.cloudera.cmon.MgmtServiceLocatorException: Could not find a HOST_MONITORING nozzle from SCM.
at com.cloudera.cmon.MgmtServiceLocator.getNozzleIPC(MgmtServiceLocator.java:143)
at com.cloudera.server.cmf.tsquery.NozzleRequest.<init>(NozzleRequest.java:50)
at com.cloudera.server.cmf.tsquery.TimeSeriesSingleRequest.<init>(TimeSeriesSingleRequest.java:40)
at com.cloudera.server.cmf.tsquery.TimeSeriesQueryService.queryTimeSeries(TimeSeriesQueryService.java:657)
at com.cloudera.server.web.reports.components.UtilizationReportsHelper.getTimeSeriesResponse(UtilizationReportsHelper.java:1040)
at com.cloudera.server.web.reports.components.UtilizationReportsHelper.getOverviewData(UtilizationReportsHelper.java:89)
at com.cloudera.api.dao.impl.UtilizationReportsDaoImpl.getUtilizationReports(UtilizationReportsDaoImpl.java:96)
at com.cloudera.cmf.command.datacollection.UtilizationReportArchiver.buildClusterUtilization(UtilizationReportArchiver.java:103)
at com.cloudera.cmf.command.datacollection.UtilizationReportArchiver.archive(UtilizationReportArchiver.java:165)
at com.cloudera.cmf.command.datacollection.DataArchiver.call(DataArchiver.java:104)
at com.cloudera.cmf.command.datacollection.DataArchiver.call(DataArchiver.java:43)
at java.util.concurrent.FutureTask.run(FutureTask.java:266)
at java.util.concurrent.ThreadPoolExecutor.runWorker(ThreadPoolExecutor.java:1149)
at java.util.concurrent.ThreadPoolExecutor$Worker.run(ThreadPoolExecutor.java:624)
at java.lang.Thread.run(Thread.java:748)
2021-04-06 17:33:40,983 ERROR DataArchiver-24:com.cloudera.api.dao.impl.UtilizationReportsDaoImpl: (1 skipped) Error getting overview usage data
com.cloudera.cmon.MgmtServiceLocatorException: Could not find a HOST_MONITORING nozzle from SCM.
Created 04-08-2021 04:54 AM
- Mark as New
- Bookmark
- Subscribe
- Mute
- Subscribe to RSS Feed
- Permalink
- Report Inappropriate Content
Resolved the issue using below steps;
Cloudera mangement service was added through UI using below steps:
On clusters home page in UI, near Status, right corner -> Add -> cloudera managemnet service
Before starting the service configure the TLS/SSL keystore like that of HDFS and YARN and restart the service.


