Support Questions
- Cloudera Community
- Support
- Support Questions
- Understanding HDFS Usage information on Ambari Das...
- Subscribe to RSS Feed
- Mark Question as New
- Mark Question as Read
- Float this Question for Current User
- Bookmark
- Subscribe
- Mute
- Printer Friendly Page
- Subscribe to RSS Feed
- Mark Question as New
- Mark Question as Read
- Float this Question for Current User
- Bookmark
- Subscribe
- Mute
- Printer Friendly Page
Understanding HDFS Usage information on Ambari Dashboard
- Labels:
-
Apache Ambari
Created 03-02-2016 02:39 PM
- Mark as New
- Bookmark
- Subscribe
- Mute
- Subscribe to RSS Feed
- Permalink
- Report Inappropriate Content
I have a four node Ambari cluster. When I look at the DFS usage on the Ambari main dashboard and look at the disk space on individual hosts, I get different figures. Following are the figures that I see on the main dashboard
HDFS Disk Usage
DFS used 49.7 GB (25.84%)
Non-DFS 66 GB (34.64%)
Remaining 76.1 GB (39.52%)
If I see the the disk space for the individual hosts, then I see the following.
host1: 28.07 GB/138.87 GB (20.21% used)
host2: 27.45 GB/138.87 GB (19.77% used)
host3: 31.45 GB/221.63 GB (14.19% used)
host4: 77.38 GB/221.38 GB (34% used)
So if you see the disk space in GB for each host is more than the total disk space shown under the HDFS disk usage. I am not able to relate these two figures.
Also, I would like to understand whether there is a any documentation that explains the different sections of the Ambari Dashboard.
Created 03-07-2016 09:26 AM
- Mark as New
- Bookmark
- Subscribe
- Mute
- Subscribe to RSS Feed
- Permalink
- Report Inappropriate Content
Created 03-02-2016 04:58 PM
- Mark as New
- Bookmark
- Subscribe
- Mute
- Subscribe to RSS Feed
- Permalink
- Report Inappropriate Content
please look at our Ambari documentation, this in particular goes over the dashboard section http://docs.hortonworks.com/HDPDocuments/Ambari-2.2.1.0/bk_Ambari_Users_Guide/content/ch_monitoring_...
and this is all our Ambari documentation http://docs.hortonworks.com/HDPDocuments/Ambari/Ambari-2.2.1.0/index.html
Created 03-07-2016 09:14 AM
- Mark as New
- Bookmark
- Subscribe
- Mute
- Subscribe to RSS Feed
- Permalink
- Report Inappropriate Content
The documents didn't help me much to understand my issue. The document provides only general information, it doesn't give me any information regarding how calculation is made. Currently my main dashboard is showing "100%" dfs consumption and I am seeing red alerts. But if I see the disk consumption of individual hosts, I do not see full consumption. Please I need some help on it so that I know how to make the full use of the hard disk space.
Created 03-07-2016 09:26 AM
- Mark as New
- Bookmark
- Subscribe
- Mute
- Subscribe to RSS Feed
- Permalink
- Report Inappropriate Content
Created 03-07-2016 10:32 AM
- Mark as New
- Bookmark
- Subscribe
- Mute
- Subscribe to RSS Feed
- Permalink
- Report Inappropriate Content
@Neeraj Sabharwal Thanks for the link. The information provided by the 'hdfs dfsadmin -report' further confuses me. For eg. currently, on the Dashboard it says DFS Used 118.7 GB. But on running the 'hdfs dfsadmin -report' command I see DFS used as 38.64 GB. Why are these figures so different different?
Created 03-07-2016 10:38 AM
- Mark as New
- Bookmark
- Subscribe
- Mute
- Subscribe to RSS Feed
- Permalink
- Report Inappropriate Content
@Pradeep kumar Can you run another report and attach ambari screeenshot?
Created on 03-07-2016 10:41 AM - edited 08-19-2019 04:51 AM
- Mark as New
- Bookmark
- Subscribe
- Mute
- Subscribe to RSS Feed
- Permalink
- Report Inappropriate Content
See this from my env

Name: 10.0.2.15:50010 (sandbox.hortonworks.com)
Hostname: sandbox.hortonworks.com
Decommission Status : Normal
Configured Capacity: 44716605440 (41.65 GB)
DFS Used: 1460805632 (1.36 GB)
Non DFS Used: 14664553157 (13.66 GB)
DFS Remaining: 28591246651 (26.63 GB)
DFS Used%: 3.27%
DFS Remaining%: 63.94%
[hdfs@sandbox ~]$ df -h
Filesystem Size Used Avail Use% Mounted on
/dev/mapper/vg_sandbox-lv_root
43G 13G 29G 31% /
tmpfs 3.9G 8.0K 3.9G 1% /dev/shm
/dev/sda1 477M 30M 422M 7% /boot
[hdfs@sandbox ~]$
Created 03-07-2016 11:00 AM
- Mark as New
- Bookmark
- Subscribe
- Mute
- Subscribe to RSS Feed
- Permalink
- Report Inappropriate Content
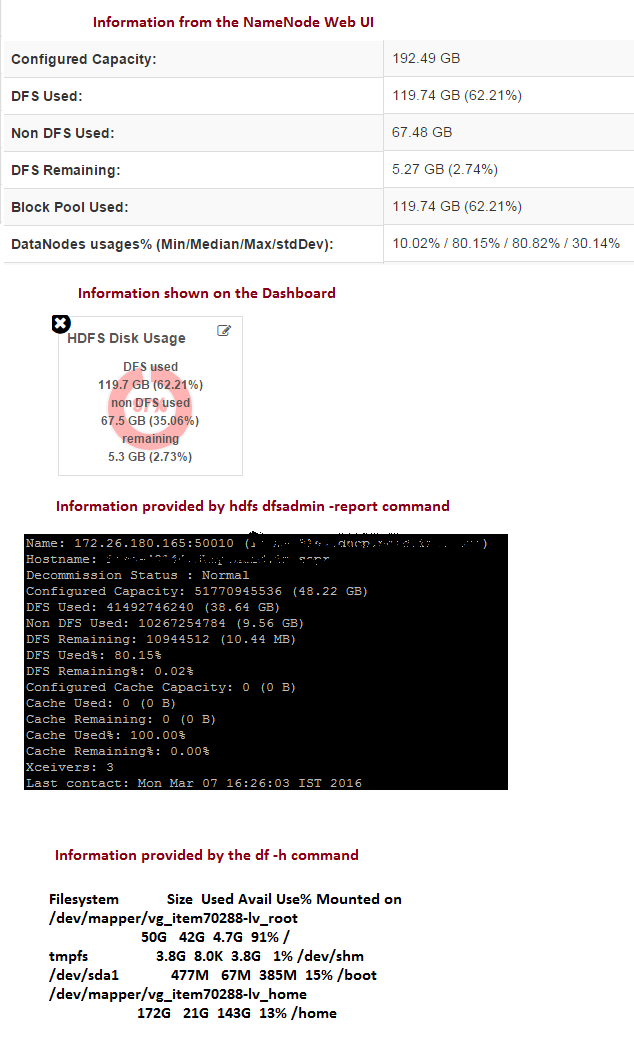
@Neeraj Sabharwal I have put all details into a image file and attached.
Created 03-07-2016 11:18 AM
- Mark as New
- Bookmark
- Subscribe
- Mute
- Subscribe to RSS Feed
- Permalink
- Report Inappropriate Content
I think I have now understood the calculation displayed on the Ambari Dashboard and NN Web UI. What confused me is the information displayed under the 'hosts' link, which displays all nodes with their hard disk consumption. The figure shown for each node (on placing the mouse over the bar), does not match with the DFS consumption. The hdfs dfsadmin -report command displays the consumption of the node on which I executed the command, which is fine. I understood this calculation after you posted the information from your cluster, so thanks again!

