Support Questions
- Cloudera Community
- Support
- Support Questions
- Re: Waiting for table metadata
- Subscribe to RSS Feed
- Mark Question as New
- Mark Question as Read
- Float this Question for Current User
- Bookmark
- Subscribe
- Mute
- Printer Friendly Page
- Subscribe to RSS Feed
- Mark Question as New
- Mark Question as Read
- Float this Question for Current User
- Bookmark
- Subscribe
- Mute
- Printer Friendly Page
Waiting for table metadata
- Labels:
-
Apache Hive
-
Apache Impala
Created on 02-04-2019 07:24 AM - edited 09-16-2022 07:07 AM
- Mark as New
- Bookmark
- Subscribe
- Mute
- Subscribe to RSS Feed
- Permalink
- Report Inappropriate Content
Hi,
I got an issue with an Hive table filled from StreamSets and queried over Impala.
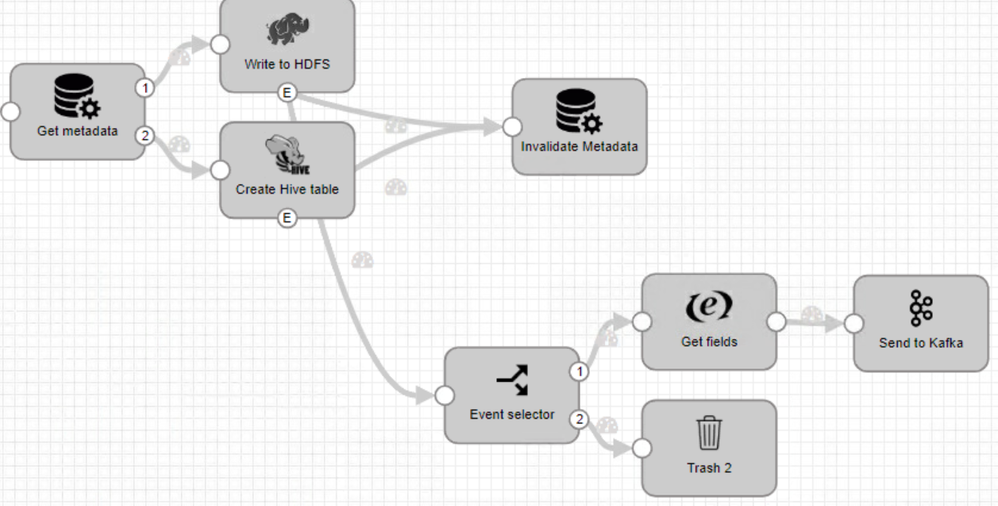
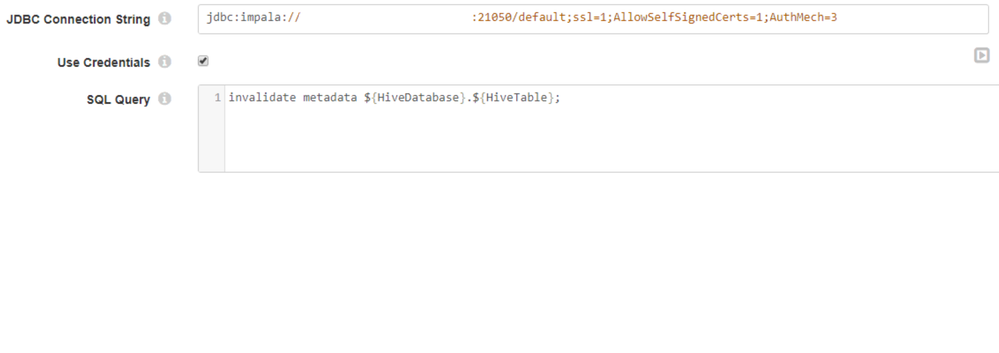
The data is processed by and StreamSets pipeline and based on the event of the HDFS destination an query via JDBC is executed to invalidate the metadata.
Data loaded with this process can be queried from Hive without any issue. But in some situations on when we try to query the table via Impala the query runs for 15 or more minutes. During this this time the query is in state "Query submittet" and can't be cancled.
When the query was completed the Exec Summary (full query log) shows that all the time has been spend on loading the metadata. When you execute the query again it runs in not time.
ExecSummary:
Operator       #Hosts   Avg Time   Max Time  #Rows  Est. #Rows   Peak Mem  Est. Peak Mem  Detail
--------------------------------------------------------------------------------------------------------------------
04:EXCHANGE         1   34.888us   34.888us      4           6   40.00 KB       16.00 KB  UNPARTITIONED
03:AGGREGATE        2    1.860ms    2.200ms      4           6    1.99 MB       10.00 MB  FINALIZE
02:EXCHANGE         2   13.413us   13.849us      4           6   16.00 KB       16.00 KB  HASH(client,export_date)
01:AGGREGATE        2  165.938us  331.876us      4           6    2.08 MB       10.00 MB  STREAMING
00:SCAN HDFS        2   23.445ms   26.392ms  1.57K          -1  325.00 KB       48.00 MB  default.my_table
    Errors:
    Query Compilation: 15m43s
       - Metadata load started: 1.387ms (1.387ms)
       - Metadata load finished. loaded-tables=1/1 load-requests=43 catalog-updates=844: 15m43s (15m43s)
       - Analysis finished: 15m43s (3.380ms)
       - Value transfer graph computed: 15m43s (616.924us)
       - Single node plan created: 15m43s (2.699ms)
       - Runtime filters computed: 15m43s (644.764us)
       - Distributed plan created: 15m43s (107.173us)
       - Lineage info computed: 15m43s (288.118us)
       - Planning finished: 15m43s (3.979ms)
    Query Timeline: 15m43s
       - Query submitted: 110.013us (110.013us)
       - Planning finished: 15m43s (15m43s)
       - Submit for admission: 15m43s (1.577ms)
       - Completed admission: 15m43s (291.293us)
       - Ready to start on 2 backends: 15m43s (467.806us)
       - All 2 execution backends (5 fragment instances) started: 15m43s (2.794ms)
       - Rows available: 15m43s (189.486ms)
       - First row fetched: 15m43s (10.843ms)
       - Last row fetched: 15m43s (162.646us)
       - Released admission control resources: 15m43s (1.224ms)
       - Unregister query: 15m43s (4.101ms)
     - ComputeScanRangeAssignmentTimer: 53.641us
    Frontend:
  ImpalaServer:
     - ClientFetchWaitTimer: 13.320ms
     - RowMaterializationTimer: 2.997ms
  Execution Profile 5c46777f31fcdc44:ae03356800000000:(Total: 195.386ms, non-child: 0.000ns, % non-child: 0.00%)
    Number of filters: 0
As it'seems there are no related messages in the catalogd or statstored logs. The only relevant message occures within impalad log:
I0204 14:55:50.923733 48147 StmtMetadataLoader.java:196] Waiting for table metadata. Waited for 450 catalog updates and 502275ms. Tables remaining: [default.aci2bd_quality]
I0204 14:55:51.084172 50813 impala-hs2-server.cc:388] GetInfo(): request=TGetInfoReq {
  01: sessionHandle (struct) = TSessionHandle {
    01: sessionId (struct) = THandleIdentifier {
      01: guid (string) = "\x8e\xccC|m\x8b@\xa7\x89_\xef\xceO\"_J",
      02: secret (string) = "H\xf5zQ\xfe\x8fK\x13\x89\xc2\x9b\xec\xafw\x06\xd4",
    },
  },
  02: infoType (i32) = 18,
}
We initiallay saw this on CDH 6.0.1 and upgraded later to CDH 6.1. But that issue still occures. The size of the tables is quite small < 1GB.
Any ideas what could be the root cause or on how to solve this issue?
Thanks in advance.
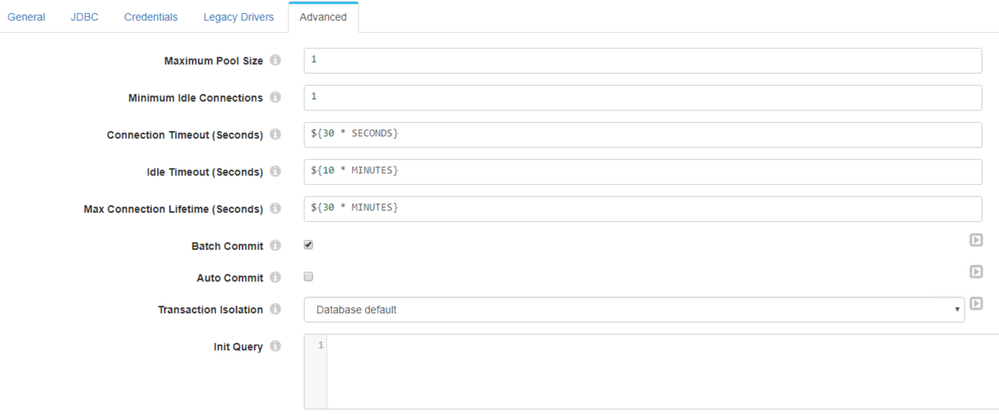
SDC pipeline settings:
Created 02-08-2019 05:30 PM
- Mark as New
- Bookmark
- Subscribe
- Mute
- Subscribe to RSS Feed
- Permalink
- Report Inappropriate Content
Hi Ragn,
I think this
- Metadata load started: 1.387ms (1.387ms)
- Metadata load finished. loaded-tables=1/1 load-requests=43 catalog-updates=844: 15m43s (15m43s)
suggests you are right that this is a metadata problem.
When you invalidate the metadata, I assume you use
INVALIDATE METADATA [[db_name.]table_name]
Do you specify the table? If you don't then Impala will load all the metadata. If you specify a table name, only the metadata for that one table is flushed and synced with the HMS, which would be quicker, I think
-Andrew
Created on 02-14-2019 02:36 AM - edited 02-14-2019 02:37 AM
- Mark as New
- Bookmark
- Subscribe
- Mute
- Subscribe to RSS Feed
- Permalink
- Report Inappropriate Content
Hi Andrew,
thanks for you reply. We already use INVALIDATE METADATA <db>.<table>.
In the meantime we saw this issue not only on invalidate statements but also on REFRESH,TRUNCATE or even SELECT commands.
Each time execution lasts for about 15 minutes until finished.
Any idea whats wrong here?
Thanks
Ralf


