Support Questions
- Cloudera Community
- Support
- Support Questions
- Re: ambari rest api for metrics
- Subscribe to RSS Feed
- Mark Question as New
- Mark Question as Read
- Float this Question for Current User
- Bookmark
- Subscribe
- Mute
- Printer Friendly Page
- Subscribe to RSS Feed
- Mark Question as New
- Mark Question as Read
- Float this Question for Current User
- Bookmark
- Subscribe
- Mute
- Printer Friendly Page
ambari rest api for metrics
- Labels:
-
Apache Ambari
Created 02-20-2018 06:54 AM
- Mark as New
- Bookmark
- Subscribe
- Mute
- Subscribe to RSS Feed
- Permalink
- Report Inappropriate Content
Is there rest api which can fetch all the details what metrics monitors collects or metrics collector does ?
Thanks in advance
Created 02-20-2018 07:11 AM
- Mark as New
- Bookmark
- Subscribe
- Mute
- Subscribe to RSS Feed
- Permalink
- Report Inappropriate Content
However one thing you can try:
You can make the following API call to query individual Host metrics for a specific time range.
example:
# curl -v "http://amb25102.example.com:6188/ws/v1/timeline/metrics?metricNames=bytes_in._rate._avg&hostname=&appId=HOST&instanceId=&startTime=1451630974&endTime=1519110315"
.
However in this case you will need to keep changing the metrics name like "byte_in" ....
The time range you can take longer like "1451630974" means starting from 1 Jan 2016 , till "1519110315" means now.
NOTE: However as mentioned earlier there is no Single API call that can be used to fetch all the AMS collector data.
Created 02-20-2018 07:02 AM
- Mark as New
- Bookmark
- Subscribe
- Mute
- Subscribe to RSS Feed
- Permalink
- Report Inappropriate Content
There is not Rest API call which can be used to capture the whole Metrics Monitors/Collectors Data in form of a file.
However you can query these data from the AMS collector Hbase database using utilities like sqlline as desceribed in
As mentioned on the other thread: https://community.hortonworks.com/questions/172151/data-source-for-ambari-metrics-collector.html?chi...
Created 02-20-2018 07:10 AM
- Mark as New
- Bookmark
- Subscribe
- Mute
- Subscribe to RSS Feed
- Permalink
- Report Inappropriate Content
is there some way I can get data what metrics monitor collect system-level metrics and publish to the Metrics Collector.
other than using sqlline .
where does metrics monitor collects system level metrics ?
Created on 02-20-2018 07:16 AM - edited 08-17-2019 06:05 PM
- Mark as New
- Bookmark
- Subscribe
- Mute
- Subscribe to RSS Feed
- Permalink
- Report Inappropriate Content
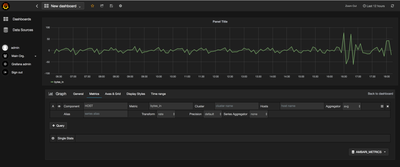
You can use Grafana to get the Host Level metrics which are sent by Ambari Metrics Monitor to Ambari Metrics Collector, By creating a custom dashboard. (Still it will be in form of Graph and not a single file with whole data)
Like: In following case i created a New Dashboard with "HOST" metrics and the metrics name is "byte_in" with Aggregator as "avg"
Created 02-20-2018 07:11 AM
- Mark as New
- Bookmark
- Subscribe
- Mute
- Subscribe to RSS Feed
- Permalink
- Report Inappropriate Content
However one thing you can try:
You can make the following API call to query individual Host metrics for a specific time range.
example:
# curl -v "http://amb25102.example.com:6188/ws/v1/timeline/metrics?metricNames=bytes_in._rate._avg&hostname=&appId=HOST&instanceId=&startTime=1451630974&endTime=1519110315"
.
However in this case you will need to keep changing the metrics name like "byte_in" ....
The time range you can take longer like "1451630974" means starting from 1 Jan 2016 , till "1519110315" means now.
NOTE: However as mentioned earlier there is no Single API call that can be used to fetch all the AMS collector data.
Created 02-20-2018 07:15 AM
- Mark as New
- Bookmark
- Subscribe
- Mute
- Subscribe to RSS Feed
- Permalink
- Report Inappropriate Content
can you please brief about all metricsNames AMS has or location for the same where I can check ?
Created 02-20-2018 07:19 AM
- Mark as New
- Bookmark
- Subscribe
- Mute
- Subscribe to RSS Feed
- Permalink
- Report Inappropriate Content
Some of the metrics list you can find here that are exposed to the AMS collector:
For All kind of metrics:
.
For particularly host specific metrics names you can refer to:
Created 02-21-2018 07:56 AM
- Mark as New
- Bookmark
- Subscribe
- Mute
- Subscribe to RSS Feed
- Permalink
- Report Inappropriate Content
Hi Jay,
curl -v "http://amb25102.example.com:6188/ws/v1/timeline/metrics?metricNames=bytes_in._rate._avg&hostname=&appId=HOST&instanceId=&startTime=1451630974&endTime=1519110315"
This rest api not working for For All kind of metrics:.
I have replaced bytes_in._rate._avg to master.Server.numDeadRegionServers
curl -v "http://amb25102.example.com:6188/ws/v1/timeline/metrics?metricNames=master.Server.numDeadRegionServers&hostname=&appId=HOST&instanceId=&startTime=1451630974&endTime=1519110315"
but not able to get the metrics results .


