Support Questions
- Cloudera Community
- Support
- Support Questions
- Re: can't get critical alerts from a dashboard
- Subscribe to RSS Feed
- Mark Question as New
- Mark Question as Read
- Float this Question for Current User
- Bookmark
- Subscribe
- Mute
- Printer Friendly Page
- Subscribe to RSS Feed
- Mark Question as New
- Mark Question as Read
- Float this Question for Current User
- Bookmark
- Subscribe
- Mute
- Printer Friendly Page
can't get critical alerts from a dashboard
- Labels:
-
Cloudera Manager
Created 02-17-2022 08:47 AM
- Mark as New
- Bookmark
- Subscribe
- Mute
- Subscribe to RSS Feed
- Permalink
- Report Inappropriate Content
Hello!
I'm using CM api v19
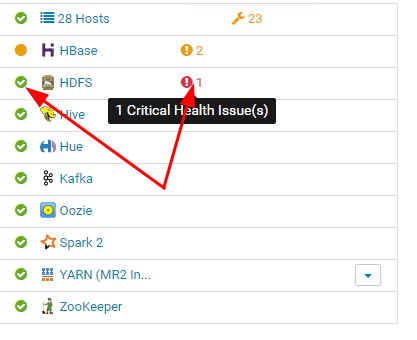
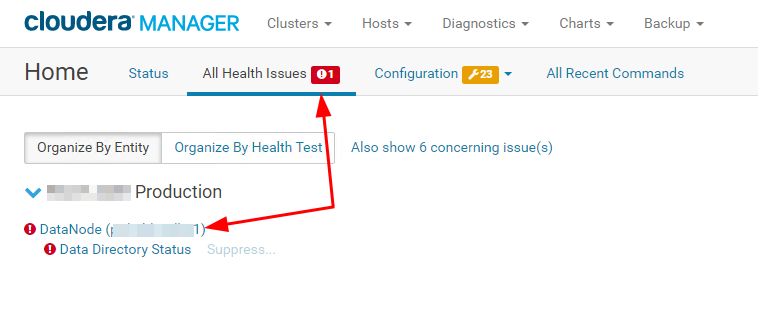
I'm trying to get only critical alerts which I'm looking at right now (RED ones).
Tried https://cloudera.github.io/cm_api/apidocs/v19/path__events.html
/api/v19/events?query=category==HEALTH_EVENT;severity=CRITICAL
The output consists of too many not relevant events. What should I do to get only critical events displayed on the dashboard?
Thank you.
Created on 02-21-2022 04:42 PM - edited 02-21-2022 04:42 PM
- Mark as New
- Bookmark
- Subscribe
- Mute
- Subscribe to RSS Feed
- Permalink
- Report Inappropriate Content
Hi, @hamsterrrrr ,
Could you please check (and share) status for each one of the roles in the HDFS service?
The endpoint /api/v40/clusters/cluster/services/hdfs/roles should give you this data.
I'd like to understand what's the underlying issue in this case.
André
Was your question answered? Please take some time to click on "Accept as Solution" below this post.
If you find a reply useful, say thanks by clicking on the thumbs up button.
Created 02-22-2022 01:51 PM
- Mark as New
- Bookmark
- Subscribe
- Mute
- Subscribe to RSS Feed
- Permalink
- Report Inappropriate Content
Thank you! Looks like what I wanted.
Created 02-17-2022 03:53 PM
- Mark as New
- Bookmark
- Subscribe
- Mute
- Subscribe to RSS Feed
- Permalink
- Report Inappropriate Content
Hi, @hamsterrrrr ,
Those events represent the point-in-time occurrence when the alert was thrown. They don't tell you the current issues with the cluster, which is what you see in the UI.
I don't think the REST API has an endpoint that gives you that list directly, but it's pretty easy to find out.
In the results of the /clusters/{cluster}/services endpoint, look for services with the status = BAD or health checks with summary = BAD. For example:
{
  "items": [
    {
      "name": "impala",
      "type": "IMPALA",
      "healthSummary": "BAD",                 <<--- this
      "healthChecks": [
        ...
        {
          "name": "IMPALA_IMPALADS_HEALTHY",
          "summary": "BAD",                   <<--- or this
          "suppressed": false
        },
        ...
      ],
      ...
    }
  ]
}
Cheers,
André
Was your question answered? Please take some time to click on "Accept as Solution" below this post.
If you find a reply useful, say thanks by clicking on the thumbs up button.
Created 02-17-2022 10:17 PM
- Mark as New
- Bookmark
- Subscribe
- Mute
- Subscribe to RSS Feed
- Permalink
- Report Inappropriate Content
Hello, André
Thanky you for yoir quick reply.
So you are saying that by using api there is no way to find out what exactly is going on with claster? All we can get is just summary like GOOD\BAD of each service? And based on this we should conduct the further investigation by means of GUI?
Created 02-18-2022 12:34 AM
- Mark as New
- Bookmark
- Subscribe
- Mute
- Subscribe to RSS Feed
- Permalink
- Report Inappropriate Content
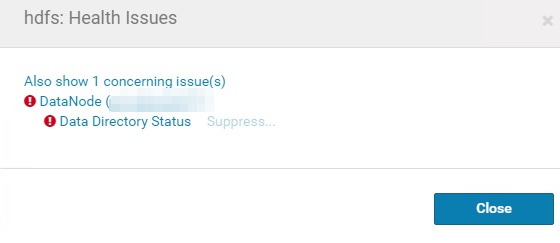
I'm saying that because the command you are talking about says that overall state of the service HDFS is good, all components of it are GOOD, while in the GUI I still can see one red red Bad health Data DIrectory Status bad health event, while overall status of HDFS is shown as GOOD(green).
Long story short, I just want to get this event via API call. Is that possible?


clusters/cluster/services/hdfs'|jq .

{

  "name": "hdfs",

  "type": "HDFS",

  "clusterRef": {

    "clusterName": "cluster"

  },

  "serviceUrl,

  "roleInstancesUrl":,

  "serviceState": "STARTED",

  "healthSummary": "GOOD",

  "healthChecks": [

    {

      "name": "HDFS_BLOCKS_WITH_CORRUPT_REPLICAS",

      "summary": "GOOD",

      "suppressed": false

    },

    {

      "name": "HDFS_CANARY_HEALTH",

      "summary": "GOOD",

      "suppressed": false

    },

    {

      "name": "HDFS_DATA_NODES_HEALTHY",

      "summary": "GOOD",

      "suppressed": false

    },

    {

      "name": "HDFS_FAILOVER_CONTROLLERS_HEALTHY",

      "summary": "GOOD",

      "suppressed": false

    },

    {

      "name": "HDFS_FREE_SPACE_REMAINING",

      "summary": "GOOD",

      "suppressed": false

    },

    {

      "name": "HDFS_HA_NAMENODE_HEALTH",

      "summary": "GOOD",

      "suppressed": false

    },

    {

      "name": "HDFS_MISSING_BLOCKS",

      "summary": "GOOD",

      "suppressed": false

    },

    {

      "name": "HDFS_UNDER_REPLICATED_BLOCKS",

      "summary": "GOOD",

      "suppressed": false

    }

  ],

  "configStalenessStatus": "FRESH",

  "clientConfigStalenessStatus": "FRESH",

  "maintenanceMode": false,

  "maintenanceOwners": [],

  "displayName": "HDFS",

  "entityStatus": "GOOD_HEALTH"

}
Created on 02-21-2022 04:42 PM - edited 02-21-2022 04:42 PM
- Mark as New
- Bookmark
- Subscribe
- Mute
- Subscribe to RSS Feed
- Permalink
- Report Inappropriate Content
Hi, @hamsterrrrr ,
Could you please check (and share) status for each one of the roles in the HDFS service?
The endpoint /api/v40/clusters/cluster/services/hdfs/roles should give you this data.
I'd like to understand what's the underlying issue in this case.
André
Was your question answered? Please take some time to click on "Accept as Solution" below this post.
If you find a reply useful, say thanks by clicking on the thumbs up button.
Created 02-22-2022 01:51 PM
- Mark as New
- Bookmark
- Subscribe
- Mute
- Subscribe to RSS Feed
- Permalink
- Report Inappropriate Content
Thank you! Looks like what I wanted.


