Support Questions
- Cloudera Community
- Support
- Support Questions
- Re: simplest method to read a full hbase table so ...
- Subscribe to RSS Feed
- Mark Question as New
- Mark Question as Read
- Float this Question for Current User
- Bookmark
- Subscribe
- Mute
- Printer Friendly Page
- Subscribe to RSS Feed
- Mark Question as New
- Mark Question as Read
- Float this Question for Current User
- Bookmark
- Subscribe
- Mute
- Printer Friendly Page
simplest method to read a full hbase table so it is stored in the cache
- Labels:
-
Apache HBase
Created on 05-19-2021 04:04 AM - edited 05-19-2021 04:04 AM
- Mark as New
- Bookmark
- Subscribe
- Mute
- Subscribe to RSS Feed
- Permalink
- Report Inappropriate Content
Dear Experts,
I am interested in accessing all the data in a hbase table once, so it will be cached.
I am using an application that reads from hbase and I notice it is a lot faster when the data was read before, so I would like to "preheat" the data by warming it up: accessing it all once, so it is stored in the cache.
I am quite familiar with the cluster configuration necessary to enable caching but wonder what is the easiest way to do this.
Is there a command that accesses all the data in all regions 1x?
Created 05-21-2021 01:51 PM
- Mark as New
- Bookmark
- Subscribe
- Mute
- Subscribe to RSS Feed
- Permalink
- Report Inappropriate Content
Hello @JB0000000000001
Appreciate your detailed response. To some of your reviews,
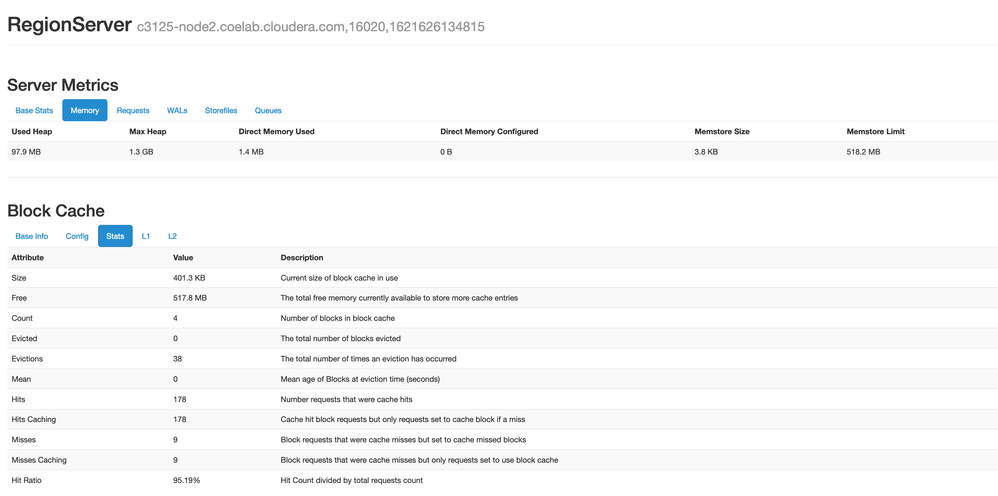
- To check upon the Impact of Row Counter on Caching, Created a Table on a Vanilla HBase Setup, Executed PE Write to insert 100,000 Rows. Flush & Restarted the Service to ensure there is no WAL Split write going through the MemStore, thereby assisting in Read Access. As shown below, there is no Read & Write with Server Metrics showing 4 Blocks of 400KB Size in Block Cache:
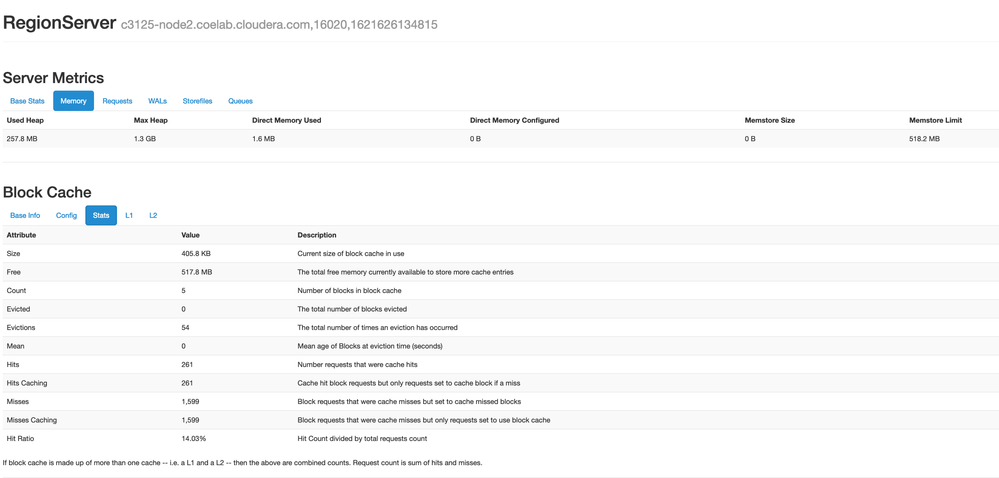
- After a RowCounter Job, We observed ~100,000 Reads with Used Heap increased around ~150MB yet Block Cache Size remained Similar.
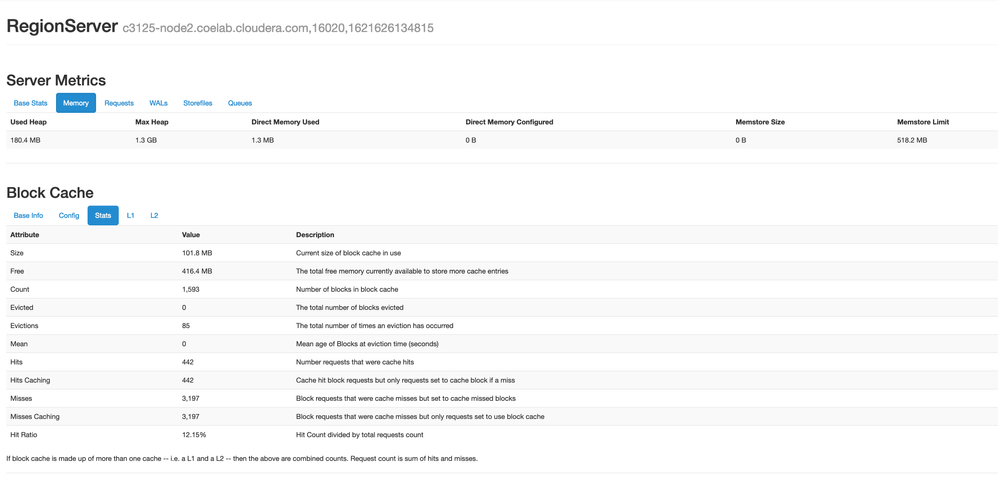
- After a Scan Operation reading each of the 100,000 Rows, the Read Request increased by 100,000 & the Block Cache Sizing increased by ~100MB & Block Count increasing by ~1500 & Hit Ration further deteriorating owing to larger Misses:
- Row Counter likely doesn't offer Caching benefits yet I have shared our Observation to ensure you can compare the same with your observation as well.
- Using the Region Server Grouping would still involve Eviction, yet the Competition & Quantity of Objects for Cache would be reduced by reducing the Tables involved within the RS Grouping Scope. This might be a bit Excessive approach yet I thought of sharing the same, in case you may wish to review.
- The Link [1] has the required Map Reduce Programs & I couldn't find anyone, which may fit the Use-Case of access all Data 1x. A Full Table Scan can be likely equivalent to running a Scan on HBase Shell for the Table. Or, Phoenix for SQL approach may be considered by you yet I believe writing a SELECT SQL using FTS is equivalent to Scanning the HBase Table via "scan".
- Link [2] does mention In-Memory Column Family are the last to evict, yet there's no guarantee that In-Memory Column Family would always remain in Memory.
- Also, I see you have "CACHE_INDEX_ON_WRITE" as True. So, I assume you might be extracting the most from your Memory unless Caching Policies possibility. While I haven't tested, Sharing Link [3] which talks about the various Caching Policies Test for Block Cache.
While I couldn't find any 100% guaranteed way to Cache the Objects, I believe you have implemented the most such functionalities already as discussed until now. I fear Compression & Encoding may not be helpful as Data is always Decompressed in Memory, likely leaving the possibility of reviewing the Caching Policies. I may have missed other possibilities & would share, if I come across any.
- Smarak
[1] https://hbase.apache.org/book.html#hbase.mapreduce.classpath
[2] https://hbase.apache.org/book.html#block.cache.design
[3] https://blogs.apache.org/hbase/entry/comparing_blockcache_deploys
Created 05-19-2021 08:50 AM
- Mark as New
- Bookmark
- Subscribe
- Mute
- Subscribe to RSS Feed
- Permalink
- Report Inappropriate Content
I have the feeling this is a good guess:
hbase org.apache.hadoop.hbase.mapreduce.RowCounter
It counts rows, but not entirely sure it will cache everything.
Created 05-21-2021 02:57 AM
- Mark as New
- Bookmark
- Subscribe
- Mute
- Subscribe to RSS Feed
- Permalink
- Report Inappropriate Content
Hello @JB0000000000001
Thanks for using Cloudera Community. You wish to store a Table in Cache via a Read-Once Model.
- As you stated, RowCounter would count the Rows & skip caching the data in the Cache as well,
- Even if you have a Block Cache configured with sufficient capacity to manage the Table's Data into the Cache, their LRU implementation would likely cause the Object to be evicted. I haven't used any other Cache implementation outside of LRU to comment.
- If you have a Set of Tables meeting such requirement, We can use RegionServer Grouping for the concerned Table's Region & ensure the BlockCache of the concerned RegionServer Group is used for Selective Tables' Regions, thereby reducing the impact of LRU.
- Test using the "IN_MEMORY" Flag for the Table's Column Families, which would try to persist the Column's Family Data as long as it can without any guarantee.
- While an Old Blog, yet [1] offers a few Practices implemented by a Heavy-HBase-Using Customer of Cloudera, written by their Employees' experience. As you are already familiar with various Heap Option, there may be no new Information for you yet I am sharing for closing any loop.
Hope the above helps. Do let us know if your Team implemented any approach so as to benefit the wider audience looking at Similar Use-Case.
- Smarak
[1] http://blog.asquareb.com/blog/2014/11/21/leverage-hbase-cache-and-improve-read-performance/
Created on 05-21-2021 08:23 AM - edited 05-21-2021 08:48 AM
- Mark as New
- Bookmark
- Subscribe
- Mute
- Subscribe to RSS Feed
- Permalink
- Report Inappropriate Content
Thank you for this very useful answer.
Some remarks:
1)I have the feeling the row counter does help. When I let it run, the read time for that table afterwards is reduced by a factor of 3. I did not look into the details and would expect it just counts the rows and does not access the data, but my test suggests it does also store some of the data.
2) Isn't there any mapreduce job availalbe that will access all the data 1x then? If this were sql, I would write a order by or SORT(something that kicks off a full table scan)? I was also trying CellCounter, but this makes my regionservers become overloaded.
2) I have set the IN_MEMORY =true already for my tables.
3)For my use case I need to do lots of heavy aggregation queries. It is always on the same couple tables. I would prefer to have these cached completely. It would be very useful if there is a method to permanently cache them. I guess the best thing I can do is the in_memory=true, but it seems like it doesnt permanently store it. I have the feeling that after a while the cache is cleaned randomly. I guess this is what you mentioned about the LRU cache that will do this... I think I am just using the standard implementation (only changed it in cloudera manager using the hfile.block.cache.size to a higher value of 0.55).
I did not understand this comment
"We can use RegionServer Grouping for the concerned Table's Region & ensure the BlockCache of the concerned RegionServer Group is used for Selective Tables' Regions, thereby reducing the impact of LRU. ". So, there is a way to prevent that the cache is cleaned again for these tables?
I can tell from the hbase master that the on-heap memory is only partially used (still more than 50% available, after I have accessed all my tables once). I have 180GB avaliable and the tables would fit in there. Too bad I can not permanently store them in memory.
Relevant settings are:
HBase: hbase.bucketsize.cache = 10 GB
HBase: hfile.block.cache.size = 0.55
HBase: Java Heap Size HBASE regionserver = 20GB
and at the catalog level:
CACHE_DATA_ON_WRITE | true |
CACHE_INDEX_ON_WRITE | true |
PREFETCH_BLOCKS_ON_OPEN | true |
IN_MEMORY | true |
BLOOMFILTER | ROWCOL |
5)The article is very interesting-I am still digesting it. One important thing I see is that the cached data is decompressed (I was not aware of this).
I see that it is recommended to have block sizes comparable to the row size of the data blocks you are interested in. Otherwise you are caching a majority of data you are not interested in. But I only use this cluster to access the same few tables which I all would like to have completely cached, so for me all data is relevant and can be cached, so maybe this will not help me.
Finally, I should figure out how to know what the size is of 1 row of data.
Once again, your responses are very advanced and helpful so thank you!
Created 05-21-2021 01:51 PM
- Mark as New
- Bookmark
- Subscribe
- Mute
- Subscribe to RSS Feed
- Permalink
- Report Inappropriate Content
Hello @JB0000000000001
Appreciate your detailed response. To some of your reviews,
- To check upon the Impact of Row Counter on Caching, Created a Table on a Vanilla HBase Setup, Executed PE Write to insert 100,000 Rows. Flush & Restarted the Service to ensure there is no WAL Split write going through the MemStore, thereby assisting in Read Access. As shown below, there is no Read & Write with Server Metrics showing 4 Blocks of 400KB Size in Block Cache:
- After a RowCounter Job, We observed ~100,000 Reads with Used Heap increased around ~150MB yet Block Cache Size remained Similar.
- After a Scan Operation reading each of the 100,000 Rows, the Read Request increased by 100,000 & the Block Cache Sizing increased by ~100MB & Block Count increasing by ~1500 & Hit Ration further deteriorating owing to larger Misses:
- Row Counter likely doesn't offer Caching benefits yet I have shared our Observation to ensure you can compare the same with your observation as well.
- Using the Region Server Grouping would still involve Eviction, yet the Competition & Quantity of Objects for Cache would be reduced by reducing the Tables involved within the RS Grouping Scope. This might be a bit Excessive approach yet I thought of sharing the same, in case you may wish to review.
- The Link [1] has the required Map Reduce Programs & I couldn't find anyone, which may fit the Use-Case of access all Data 1x. A Full Table Scan can be likely equivalent to running a Scan on HBase Shell for the Table. Or, Phoenix for SQL approach may be considered by you yet I believe writing a SELECT SQL using FTS is equivalent to Scanning the HBase Table via "scan".
- Link [2] does mention In-Memory Column Family are the last to evict, yet there's no guarantee that In-Memory Column Family would always remain in Memory.
- Also, I see you have "CACHE_INDEX_ON_WRITE" as True. So, I assume you might be extracting the most from your Memory unless Caching Policies possibility. While I haven't tested, Sharing Link [3] which talks about the various Caching Policies Test for Block Cache.
While I couldn't find any 100% guaranteed way to Cache the Objects, I believe you have implemented the most such functionalities already as discussed until now. I fear Compression & Encoding may not be helpful as Data is always Decompressed in Memory, likely leaving the possibility of reviewing the Caching Policies. I may have missed other possibilities & would share, if I come across any.
- Smarak
[1] https://hbase.apache.org/book.html#hbase.mapreduce.classpath
[2] https://hbase.apache.org/book.html#block.cache.design
[3] https://blogs.apache.org/hbase/entry/comparing_blockcache_deploys
Created on 05-26-2021 07:17 AM - edited 05-26-2021 08:26 AM
- Mark as New
- Bookmark
- Subscribe
- Mute
- Subscribe to RSS Feed
- Permalink
- Report Inappropriate Content
Many thanks for this detailed answer which again far exceeded my expectations. I marked the whole discussion as the correct solution as it will be of interest for others.
I only wanted to add : I conform I do see an effect of the rowcount.
If I do my aggregation queries after running the rowCount mapreduce job, the time improves by a factor of 3-4.
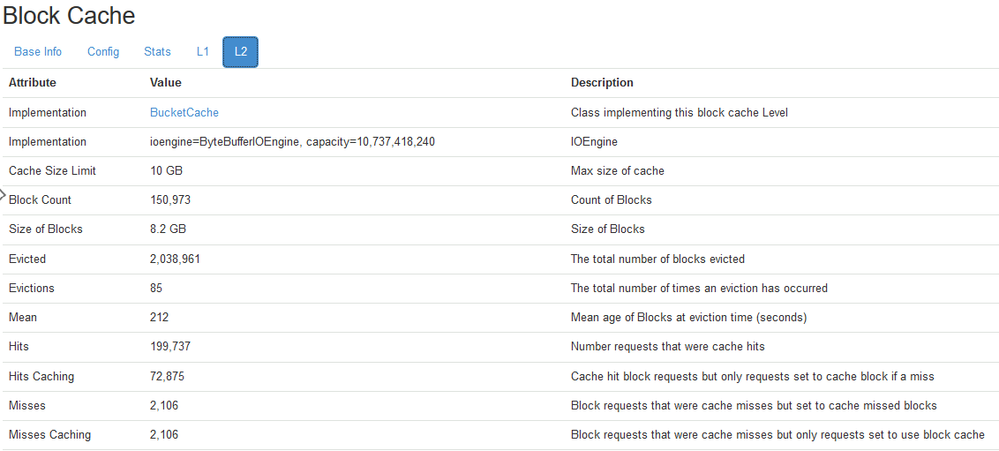
Possibly the consequence of one of the other settings I apply (like bloom filter? or something else)? When I look at the difference between L1/L2 cache, I see following behavior after running the MR job for rowcount:
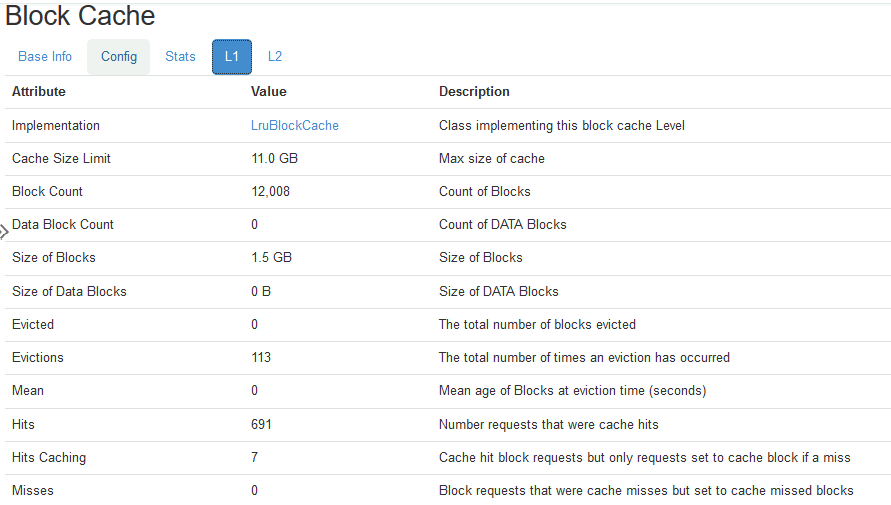

This shows that most of caching happens in L2 cache. According to this article https://blog.cloudera.com/hbase-blockcache-101/ for me (using CombinedBlockCache), the L1 is used to store index/bloom filter blocks and the L2 is used to store data blocks.
Now when I really use my application (and fire heavy aggregations, that now go much faster thanks to the MR job) I see similar behavior. As I assume the true aggregations will make use of caching, I almost am inclined to think that the MR job for rowcount does help me to fill the necessary L2 cache: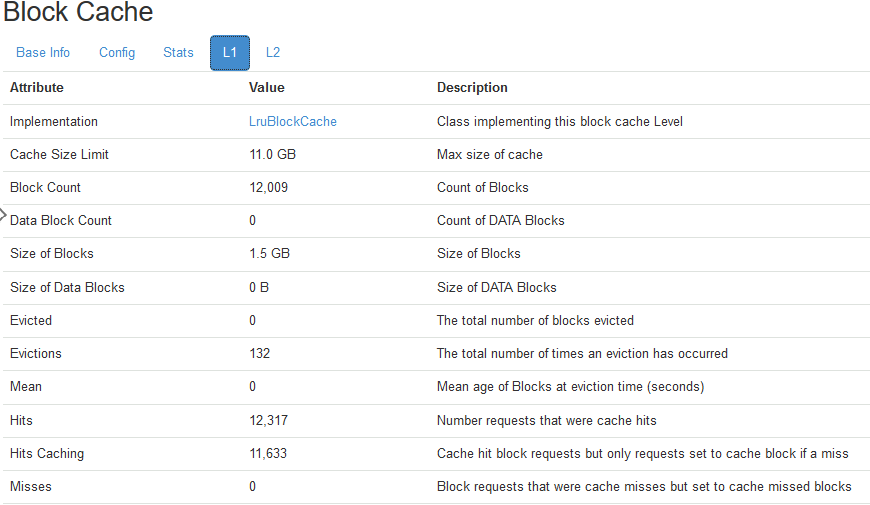
Created 05-26-2021 07:50 AM
- Mark as New
- Bookmark
- Subscribe
- Mute
- Subscribe to RSS Feed
- Permalink
- Report Inappropriate Content
Hello @JB0000000000001
Thanks for the Kind Words. I certainly thought in the same direction that the RowCounter may not be explicitly caching the Data yet the Hfiles Metadata (Index, Bloom Filter) enough to likely improve the Subsequent queries with the rejection of Hfiles to be processed, thereby assisting by reducing the scope of Hfiles to be reviewed before returning the Output.
Thanks again for using Cloudera Community & helping fellow Community Members by sharing your experiences around HBase.
- Smarak
Created 05-26-2021 09:04 AM
- Mark as New
- Bookmark
- Subscribe
- Mute
- Subscribe to RSS Feed
- Permalink
- Report Inappropriate Content
Would by any chance you know of any page that very clearly describes the fields shown in the hbase master ui?
I find lots of blogs about it, but would be interesteing in seeing one that brings clarity of all metrics.
Created 05-26-2021 10:52 PM
- Mark as New
- Bookmark
- Subscribe
- Mute
- Subscribe to RSS Feed
- Permalink
- Report Inappropriate Content
Hello @JB0000000000001
Unfortunately, I didn't find any 1 Document explaining the HMaster UI Metrics collectively. Let me know if you come across any Metrics, which isn't clear. I shall review the same & share the required details. If I can't help, I shall ensure I get the required details from our Product Engineering Team to assist as well.
- Smarak

