
Our Community is getting an upgrade! To get everything ready for the relaunch, we’ll be placing the site in read-only mode starting September 21st.
We really appreciate your understanding while we get things set up behind the scenes. Catch up on all the exciting details about the move here.
Need help or have questions? Drop us a line at [email protected]

Archives of Support Questions (Read Only)
- Cloudera Community
- Board Archive
- Archives of Support Questions (Read Only)
- Who agreed with this solution
Who agreed with this solution



Created on 07-17-2014 08:22 AM - edited 07-17-2014 08:23 AM
- Mark as New
- Bookmark
- Subscribe
- Mute
- Subscribe to RSS Feed
- Permalink
- Report Inappropriate Content
Hi ranks,
In Cloudera Manager 5 and higher, every chart you see in the web UI will provide you a direct /timeseries URL showing exactly how that chart itself retrieved metrics with the /timeseries endpoint! You can grab this same URL and use it with curl.
Find any chart and click on the blue arrow that will appear at the top-right. Choose "Export JSON". This will open a new window with the location bar already populated. This URL is a fully-formatted /timeseries API endpoint! Feel free to use any of them as a springboard for your curl testing. I tried to post one here but the forum doesn't like the URL and won't let me post. However it'd look like this:
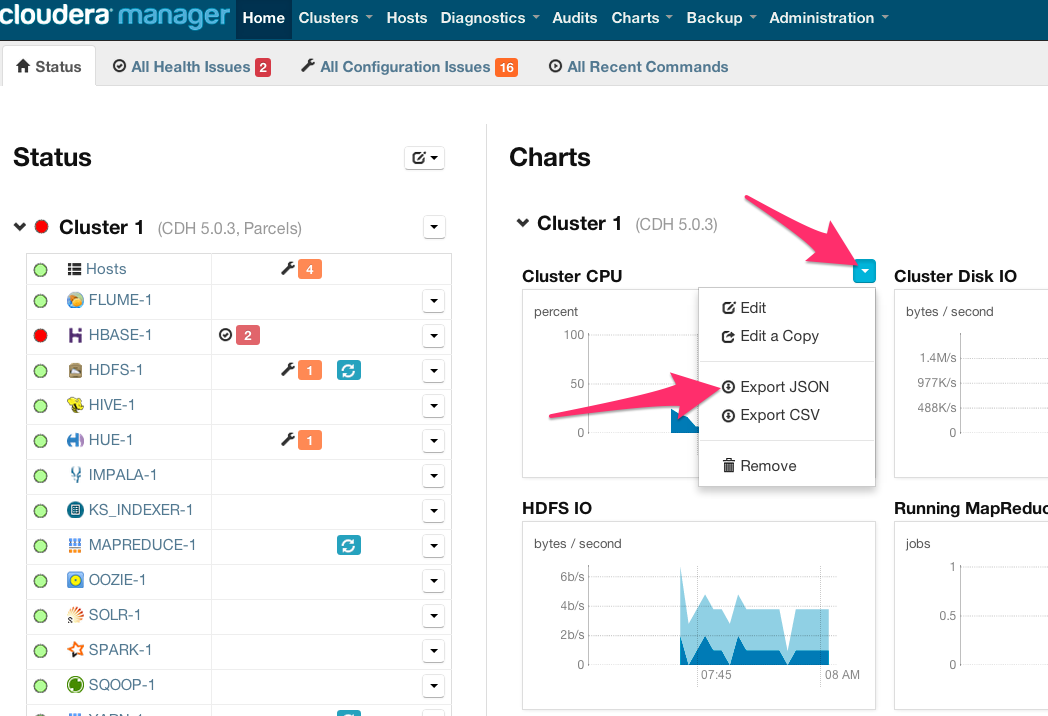

I can use this now directly with my curl command ($curl -v -u $USER:$PASS '$URL') and I get json output as requested.
$ curl -v -u $USER:$PASS 'http://my.cluster.com:7180/api/v6/timeseries?query=select+cpu_percent_across_hosts+where+category+%3...
Hope this helps! Add -v and/or -i to your curl testing to get more information about the 400 error you're getting, as needed.
--
Mark S.
