Community Articles
- Cloudera Community
- Support
- Community Articles
- Ambari Infra Solr (Ambari 2.x) setup recommendatio...
- Subscribe to RSS Feed
- Mark as New
- Mark as Read
- Bookmark
- Subscribe
- Printer Friendly Page
- Report Inappropriate Content
- Subscribe to RSS Feed
- Mark as New
- Mark as Read
- Bookmark
- Subscribe
- Printer Friendly Page
- Report Inappropriate Content
Created on 12-18-2017 05:33 PM - edited 08-17-2019 09:31 AM
If Ranger is setup to use Solr to store audits, it is necessary to configure Solr and Ranger Solr collection properly in order to keep our system stable. Here, there is no any magic number about the number of Solr nodes/shards, because with Ranger the required numbers are based on the load (generated by master components). If there are lots of ongoing jobs on your cluster, obviously it will generate more audits. (It matters more how busy is your cluster than how many machines do you have – of course, if you have more resources, then your system can handle more load)
Ambari Infra Solr load test on Ranger Solr collection
In order to get the proper (approximate) Solr settings with Ranger audits, we had to do some scale/load testing. For this purpose we also need something to visualize the results, because we need to understand what happened during the load. Here we can use AMS + Grafana. As Ambari Infra uses Solr 5.5.2, it has no Solr Metrics API in that Solr release, so we need a component to somehow send Solr metrics to AMS. Solr has JMX support, so what we can do is to create a component, which gather Solr JMX details and push the metrics to AMS.
Ambari mpack to periodically send JMX data to AMS (with pre-defined Grafana dashboards):
https://github.com/oleewere/ams-solr-metrics-mpack (unofficial, I created to myself to help scale/load testing)
Ambari cluster setup for load testing:
- Services: Ranger, Infra Solr, Zookeeper, AMS (distributed mode), HBase, KNOX, Kafka, HDFS, YARN, Hive, Solr Metrics (the mpack that you can see above)
- Number of nodes: ~60 nodes, 8 Solr nodes
- Node details: 4CPU 15G RAM
- Solr heap: 5G (anything else is default)
After first day run I started with relatively small load, only ~1 million Ranger audit data per day with just only one shard:
- Number of audits: 9.5 million
- Index size: ~1GB
- CPU load - average 0.5%, max 2%
- Heap – average: 265MB, max: 302MB
- Number of threads - average/max: 31
- Connections - ESTABLISHED: ~10, CLOSE_WAIT: 1, TIME_WAIT: 1
- Transaction log size - average: 132MB, max: 170MB
Based on these metrics, we can calculate with that: 10 million audit doc is about 1GB index. As you can see the system values seems to be stable, did not hit any limits, but that is expected with this small load. From this point we can increase the load, also it worth to mention how to add new shards for Ranger Solr Audit collection. As Ranger uses compositeId for routing, therefore, you will need to split the shards (if the number is not right originally);
For example if you have a shard called shard1 in ranger_audit collection, the split shard request can look like this:
http://<solr_address>:8886/solr/admin/collections?action=SPLITSHARD&collection=ranger_audits&shard=s...
Wait until the request finishes, you can check the status with:
http:// <solr_address>:8886/solr/admin/collections?action=REQUESTSTATUS&requestid=1000&wt=json
That will put your original core to inactive status, you can use UNLOAD action on that if you would like to delete it. (note: both new cores will be on the same machine, so it is possible you will need to move one of the core to somewhere else – like you can create a new replica from that, and delete the old one)
As we have multiple nodes, we can start the load again (with higher throughput): ~265mill doc/day, then the result after a few days run (both shard on the same node):
- Number of audits: ~615Million
- Index size: ~70G (35 – 35 G)
- CPU load - average 74%, max 88%
- Heap – average: 1,7 GB, max: 1,88 GB
- Number of threads – average: 183, max: 257
- Connections - ESTABLISHED: ~110, CLOSE_WAIT: ~90, TIME_WAIT: 6K
- Transaction log size - average: 132MB, max: 256MB
As you can see there are a lot of network connections created (6K), so with high load, you can run out of network connections. To fix that you can use the following system network settings: (sysctl):
net.ipv4.tcp_max_tw_buckets = 1440000
net.ipv4.tcp_tw_recycle = 1
net.ipv4.tcp_tw_reuse = 1
(note: As net.ipv1.tcp_tw_recycle has been removed from later versions of Linux TCP stack, you can increase net.core.somaxconn and net.ipv4.tcp_fin_timeout to get more half-open connections than recycle/reuse kernel structures)
(other recommended system settings: https://community.hortonworks.com/articles/90955/how-to-fix-ambari-infra-solr-throwing-outofmemorye....)
Also we noticed, there were often large GC pause times, we did not use G1 GC (which can be used to set a low GC pause time, default is 250msec), so we changed the configuration use that (in infra-solr-env/content property):
GC_TUNE="-XX:+UseG1GC -XX:+PerfDisableSharedMem -XX:+ParallelRefProcEnabled -XX:G1HeapRegionSize=3m -XX:MaxGCPauseMillis=250 -XX:InitiatingHeapOccupancyPercent=75 -XX:+UseLargePages -XX:+AggressiveOpts"
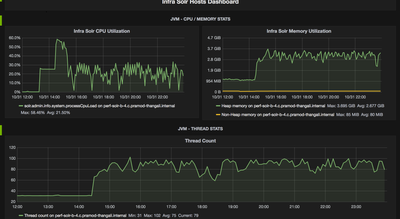
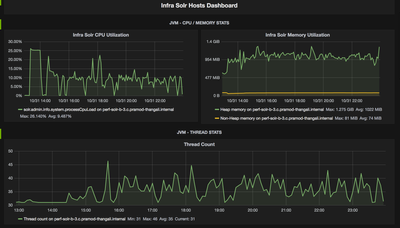
Then I moved one of the cores to another Solr node in order to test them with in different circumstances. (I will stop one of them, and in the last day of load test, I will start it again), the result was after few days run:
Number of audit records: ~1,2 billion
Node 1 (load ran more days):
- Index size: ~83G
- CPU load - max 60%
- Heap – average: 2.7 GB, max: 3,6 GB
- Number of threads – average: 75, max: 102
- Connections - ESTABLISHED: 48, CLOSE_WAIT: 59, TIME_WAIT: 17
- Transaction log size – 200-400 MB
(note: daily load started at ~14:00)
Node 2 (1 day ran):
- Index size: ~45G
- CPU load - max 26%
- Heap – average: 1 GB, max: 1,2 GB
- Number of threads – average: 35, max: 38
- Connections - ESTABLISHED: 28, CLOSE_WAIT: 4, TIME_WAIT: 4
- Transaction log size – 2-4 MB
You can notice, the TIME_WAIT connections are looking much better, that is because of the sysctl settings that I modified before.
Conclusion
Solr is the right tool for handling tokenized static data, but it is required the find out the proper configuration with dynamically growing data. (That is the case with Ranger audits) As the goal is to keep the system stable, so it is better to start with the right number of cores/shards/replicas, as splitting shards / adding new replicas can be really costly, and most of the time it’s “required” when your Solr cluster reached the limits. (Also we need to keep the transaction log size small as possible, one of the way to doing this is horizontal scaling) Based on the metrics that we have and the TTL (time-to-leave) values of Ranger audits (default: 90 days), we can approximately recommend the following settings for our Solr cluster:
- Use G1 GC (set in infra-solr-env/content) – for low pause time
- For production set JVM memory ~10-12 G
- Number of shards: keep data below 25G / shard, oversharding is ok, you can predict how many shards you will need as you can count with ~ 1million doc / GB, so TTL * # of docs with one day load =~ max index size
- Every shard should have at least an another replica (it is useful if you want to remove a host, you can delete the replicas from there then add new ones into an another host)
- Shards per node: 2-3, but it can be higher, based on how much memory Solr uses
- OS settings: reuse sockets (as you can run out of network connections) – you can find the sysctl settings above
Appendix (performance factors – in solrconfig.xml):
- Limit the indexing buffer size:
All documents kept in memory until it exceeds RAM buffer size (defined in solrconfig.xml):
<ramBufferSizeMB>100</ramBufferSizeMB>
Once it exceeded, Solr creates a new segment / merge index to the new segment. (100 MB is the default one). You can set the limit based on doc size as well.
<maxBufferedDocs>1000</maxBufferedDocs>
If the RAM size cross the limit, then it will flush the changes.
Note: With <maxIndexingThread> you can also control the number of threads that are used for indexing. (default: 😎
High frequency commits: use more CPU time
Low frequency commits: use more memory of your instance
2. Commits:
Commit - make sure updates are stored on the disk.
Automatic commits: when enabled, docs automatically written to the storage (based on some conditions), hard commit will replicate index on all nodes (on cluster environment). Conditions are: <maxTime> or <maxDoc>, choose them to be lower value if there are continuous index updates in your system. Also there is an option <openSearcher>, if it’s true enables committed changes to be visible immediately. (new searcher)
Soft commits: faster than hard commits, makes index change visible for searches, does not any sync index across nodes. (near real time) Power failure -> data lost. Soft commit <maxTime> should be set less than hard commit time.
Update Log: Enables transaction logs, those are used for recovery of updates (replay during startup) and durability. It’s recommended to have hard commit size limit based on update log size.
Example:
<updateHandler class=”solr.DirectUpdateHandler2”>
  <updateLog>
    <str name=”dir”>${solr.ulog.dir:}</str>
   </updateLog>
   <autoCommit>
     <maxTime>15000</maxTime>
     <openSearcher>false</openSearcher>
   </autoCommit>
   <autoSoftCommit>
     <maxTime>1000</maxTime>
   </autoSoftCommit>
</updateHandler>
3. Optimizing index merge:
Merge factor: This value tells lucene how many segments should be built before merging them to a single one. (<mergeFactor> in <indexConfig>)
High merge factor: (e.g. 20) improves indexing speed, resulting more index files so searches will be slower.
Low merge factor: (e.g. 5) improves searches, but because of more segment merge that slows down the indexing.
4. Caches:
Common parameters:
class: solr.LRUCache, solr.LFUCache, solr.FastLRUCache
initialSize: initial capacity for the cache (hashMap)
size: max size of the cache
autowarmCount: when a new searcher is opened, its cache can be pre-populated, that set the number of items that will be generated from the old caches,
4.1 Field cache (per node): Used for sorting and faceting. Lucene low level field cache, that is not managed by Solr so it has no configuration options. Store field values.
4.2 Filter cache (per core): This cache is responsible to storing documents (ids) for filter queries. If you have faceting, using this can improve performance. (if docs continuously grows maybe it worth to disable it, especially if you are using a lot of different filter queries really often)
4.3. Document cache (per core): This cache is storing lucene documents that are fetched from the disk. That can reduce disk I/O. The size needs to be larger than max_results * max_concurrent_queries. (requires relatively small heap)
4.4 Field value cache (per core): This cache is mainly for faceting. Similar as field cache, but It supports multi-valued fields. If it is not declared in solrconfig.xml, it’s generated automatically with initial size 10 (up to 10000)
4.5 Query result cache (per core): This cacheis storing the top n query results. (ordered set of document ids -> therefore it use much less memory than filter cache) (requires relatively small heap)
Cache sizing: Smaller cache size can help to avoid full garbage collections.
Disabling caches: Comment out caching section.
Cache Example (in solrconfig.xml):
<query>
  <documentCache class=”solr.LRUCache” size=”512” initialSze=”512” autowarmCount=”0”/>
  ...
</query>
5. TTL (time to leave):
<updateRequestProcessorChain ...>
  <processor class=”solr.DefaultValueUpdateProcessorFactory” >
    <str name=”fieldName”>_ttl_</str>
    <str name=”value”>+7DAYS</str>
  </processor>
  <processor class=”solr.DocExpirationUpdateProcessorFactory”>
    <int name=”autoDeletePeriodSeconds”>8600</str>
    <str name=”ttlFieldName”>_ttl_</str>
    <str name=”expirationFieldName”>_expire_at_</str>
  </processor>
  <processor class=”solr.FirstFieldValueUpdateProcessorFactory”>
    <str name=”fieldName”>_expire_at_</str>
  </processor>
  ...
</updateRequestProcecssorChain>
Created on 03-18-2018 12:29 AM
- Mark as Read
- Mark as New
- Bookmark
- Permalink
- Report Inappropriate Content
The amount of memory needed by Ambari Infra Solr by default is too high due to poor configuration choices. I wrote about what simple changes can be made to make Solr significantly more performant on less heap. We have Solr with less than 4GB of heap holding billions of documents.
https://risdenk.github.io/2017/12/18/ambari-infra-solr-ranger.html


