Community Articles
- Cloudera Community
- Support
- Community Articles
- Capturing hardware statistics for Spark, Hadoop, N...
- Subscribe to RSS Feed
- Mark as New
- Mark as Read
- Bookmark
- Subscribe
- Printer Friendly Page
- Report Inappropriate Content
- Subscribe to RSS Feed
- Mark as New
- Mark as Read
- Bookmark
- Subscribe
- Printer Friendly Page
- Report Inappropriate Content
Created on 12-01-2016 10:07 PM - edited 08-17-2019 07:34 AM
Quick tips on how to find low level hardware performance stats. I use it often for NiFi/Spark/Hadoop. This is not limited to those use services. Additionally, this is not a exhaustive list nor am I advocating one tool over the another. Just a few I have ran over the years during my implementations/POCs experience. These give me insights whether I have allocated enough physical resources to run the services. I highly recommend not assuming what your hardware can or can't do. Benchmark it! How? Read my article here.
Lets get to it.
CPU stats
iostat -c 1 3 will provide you cpu stats every 1 second 3 times. Output of the report (sourced right from here😞
CPU Utilization Report
The first report generated by the iostat command is the CPU Utilization Report. For multiprocessor systems, the CPU values are global averages among all processors. The report has the following format:


%user
Show the percentage of CPU utilization that occurred while executing at the user level (application).


%nice
Show the percentage of CPU utilization that occurred while executing at the user level with nice priority.


%system
Show the percentage of CPU utilization that occurred while executing at the system level (kernel).


%iowait
Show the percentage of time that the CPU or CPUs were idle during which the system had an outstanding disk I/O request.


%steal
Show the percentage of time spent in involuntary wait by the virtual CPU or CPUs while the hypervisor was servicing another virtual processor.


%idle
Show the percentage of time that the CPU or CPUs were idle and the system did not have an outstanding disk I/O request.
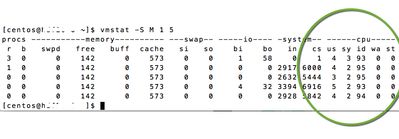
vmstat -S M 1 5 will report in megabyte every 1 second 5 times. The megabyte indicator (-S M) is not important here since we are only looking at CPU.
Output of the report (sourced right from here)
The us column reports the amount of time that the processor spends on userland tasks, or all non-kernel processes.


The sy column reports the amount of time that the processor spends on kernel related tasks.


The id column reports the amount of time that the processor spends idle.


The wa column reports the amount of time that the processor spends waiting for IO operations to complete before being able to continue processing tasks.
Memory stats
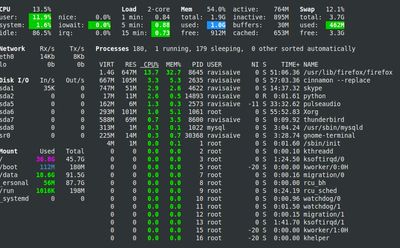
glances is a tool I use for many stats since the UI is much friendlier then most tools. execute glances on command line to view stats for disk, io, and memory. You can also use it as client/server grabbing stats from remote servers. Here you can see swap as well (Sourced from here)
Another method is to run vmstat 1 5 which will read stats every 1 second 5 times. Output of memory stats (source from here)
       swpd: the amount of virtual memory used.
       free: the amount of idle memory.
       buff: the amount of memory used as buffers.
       cache: the amount of memory used as cache.
       inact: the amount of inactive memory. (-a option)
       active: the amount of active memory. (-a option)
Monitor the swpd. If you are swapping too much you will find your CPU will run hot.
Disk stats
Glance is good tool to monitor IO. Take a look at the glances screen shot you will see the io stats.
iostat -d 1 5 will output disk stats every 1 second 5 times.
Output of the report (sourced right from here)
Device Utilization Report
The device report provides statistics on a per physical device or partition basis. Block devices for which statistics are to be displayed may be entered on the command line. Partitions may also be entered on the command line providing that option -x is not used. If no device nor partition is entered, then statistics are displayed for every device used by the system, and providing that the kernel maintains statistics for it. If the ALL keyword is given on the command line, then statistics are displayed for every device defined by the system, including those that have never been used. The report may show the following fields, depending on the flags used:
Device:


This column gives the device (or partition) name, which is displayed as hdiskn with 2.2 kernels, for the nth device. It is displayed as devm-n with 2.4 kernels, where m is the major number of the device, and n a distinctive number. With newer kernels, the device name as listed in the /dev directory is displayed.
tps
Indicate the number of transfers per second that were issued to the device. A transfer is an I/O request to the device. Multiple logical requests can be combined into a single I/O request to the device. A transfer is of indeterminate size.


Blk_read/s
Indicate the amount of data read from the device expressed in a number of blocks per second. Blocks are equivalent to sectors with kernels 2.4 and later and therefore have a size of 512 bytes. With older kernels, a block is of indeterminate size.


Blk_wrtn/s
Indicate the amount of data written to the device expressed in a number of blocks per second.


Blk_read
The total number of blocks read.


Blk_wrtn
The total number of blocks written.


kB_read/s
Indicate the amount of data read from the device expressed in kilobytes per second.


kB_wrtn/s
Indicate the amount of data written to the device expressed in kilobytes per second.


kB_read
The total number of kilobytes read.


kB_wrtn
The total number of kilobytes written.


MB_read/s
Indicate the amount of data read from the device expressed in megabytes per second.


MB_wrtn/s
Indicate the amount of data written to the device expressed in megabytes per second.


MB_read
The total number of megabytes read.


MB_wrtn
The total number of megabytes written.


rrqm/s
The number of read requests merged per second that were queued to the device.


wrqm/s
The number of write requests merged per second that were queued to the device.


r/s
The number of read requests that were issued to the device per second.


w/s
The number of write requests that were issued to the device per second.


rsec/s
The number of sectors read from the device per second.


wsec/s
The number of sectors written to the device per second.


rkB/s
The number of kilobytes read from the device per second.


wkB/s
The number of kilobytes written to the device per second.


rMB/s
The number of megabytes read from the device per second.


wMB/s
The number of megabytes written to the device per second.


avgrq-sz
The average size (in sectors) of the requests that were issued to the device.


avgqu-sz
The average queue length of the requests that were issued to the device.
await
The average time (in milliseconds) for I/O requests issued to the device to be served. This includes the time spent by the requests in queue and the time spent servicing them.


svctm
The average service time (in milliseconds) for I/O requests that were issued to the device. Warning! Do not trust this field any more. This field will be removed in a future sysstat version.
%util
Percentage of CPU time during which I/O requests were issued to the device (bandwidth utilization for the device). Device saturation occurs when this value is close to 100%.
vmstat -d 1 5 will run disk stats every 1 second 5 times. Output of the report (source from here)
   Reads
       total: Total reads completed successfully
       merged: grouped reads (resulting in one I/O)
       sectors: Sectors read successfully
       ms: milliseconds spent reading


   Writes
       total: Total writes completed successfully
       merged: grouped writes (resulting in one I/O)
       sectors: Sectors written successfully
       ms: milliseconds spent writing


   IO
       cur: I/O in progress
       s: seconds spent for I/O
I like glances the best due to its friendly output if your disk are running too hot.
Network stats
Glances again provide easy way to read network stats. Take a look at glances screen shot above.
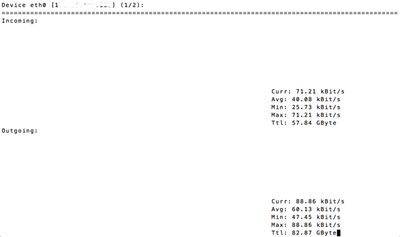
nload is a good utility to read current network stats
Lastly you can run sudo iftop -h which will display tons of network stats. I obviously hide my IP address


