Our Community is getting an upgrade! To get everything ready for the relaunch, we’ll be placing the site in read-only mode starting September 21st.
We really appreciate your understanding while we get things set up behind the scenes. Catch up on all the exciting details about the move here.
Need help or have questions? Drop us a line at [email protected]

Community Articles

Find and share helpful community-sourced technical articles.
Announcements
Share your experience with Cloudera on G2 and get a $25 Amazon Gift card.
Hi, I'm CLEO! Something exciting is coming to the Community. Stay Tuned!
Labels (2)
avatar
Contributor

This article will give a quick demonstration to add Leaflet maps to an Angular paragraph in Zeppelin.

Background: Leaflet Maps

Leaflet is an open-source JavaScript library for interactive maps. Leaflet is designed with simplicity, performance and usability in mind.

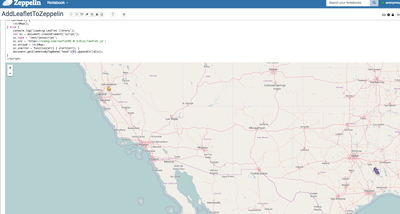
Step 1: Adding a map to a Zeppelin notebook.

13931-screen-shot-2017-03-22-at-114134-am.png

Code Source:

%angular 
<link rel="stylesheet" href="https://unpkg.com/[email protected]/dist/leaflet.css" />
<div id="map" style="height: 800px; width: 100%"> </div>
<script type="text/javascript">
function initMap() {
    var map = L.map('map').setView([33.415, -111.831], 6);
    L.tileLayer('http://{s}.tile.openstreetmap.org/{z}/{x}/{y}.png', {
        attribution: 'Map data © <a href="http://openstreetmap.org">OpenStreetMap</a> contributors',
        maxZoom: 15,
        minZoom: 3
    }).addTo(map);
    var geoMarkers = L.layerGroup().addTo(map);
   
}
if (window.L) {
    initMap();
} else {
    console.log('Loading Leaflet library');
    var sc = document.createElement('script');
    sc.type = 'text/javascript';
    sc.src='https://unpkg.com/[email protected]/dist/leaflet.js';
    sc.onload = initMap;
    sc.onerror = function(err) { alert(err); }
    document.getElementsByTagName('head')[0].appendChild(sc);
}
</script>

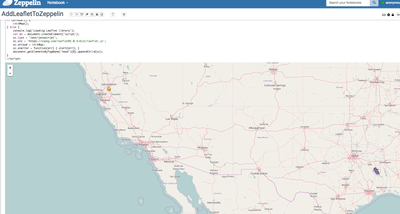
Step 2: Adding markers to the map manually.

13932-screen-shot-2017-03-22-at-114134-am.png

Code Source:

%angular 
<link rel="stylesheet" href="https://unpkg.com/[email protected]/dist/leaflet.css" />
<div id="map" style="height: 800px; width: 100%"> </div>
<script type="text/javascript">
function initMap() {
    var map = L.map('map').setView([33.415, -111.831], 12);
    L.tileLayer('http://{s}.tile.openstreetmap.org/{z}/{x}/{y}.png', {
        attribution: 'Map data © <a href="http://openstreetmap.org">OpenStreetMap</a> contributors',
        maxZoom: 15,
        minZoom: 3
    }).addTo(map);
    var geoMarkers = L.layerGroup().addTo(map);
    var lat = 31.603513;
    var long = -94.655487;
    var lat1 = 38.381572;
    var long1 = -121.49440;
    var LJIcon = L.icon({
    iconUrl: 'https://upload.wikimedia.org/wikipedia/en/f/ff/SFA_Athletics_logo.png',
    iconSize: [38, 38],
    });
    var goldIcon = L.icon({
    iconUrl: 'http://www.pngmart.com/files/3/Lakshmi-Gold-Coin-PNG-Transparent-Image.png',
    iconSize: [20, 20],
    });
   var marker = L.marker([ lat, long ],{icon: LJIcon} ).bindPopup("Nacogdoches, Tx" +" : " + "21ABC").addTo(map);
    var marker1 = L.marker([ lat1, long1 ],{icon: goldIcon} ).bindPopup("Sacramento, Ca" +" : " + "34DGC").addTo(geoMarkers)
}
if (window.L) {
    initMap();
} else {
    console.log('Loading Leaflet library');
    var sc = document.createElement('script');
    sc.type = 'text/javascript';
    sc.src='https://unpkg.com/[email protected]/dist/leaflet.js';
    sc.onload = initMap;
    sc.onerror = function(err) { alert(err); }
    document.getElementsByTagName('head')[0].appendChild(sc);
}
</script>

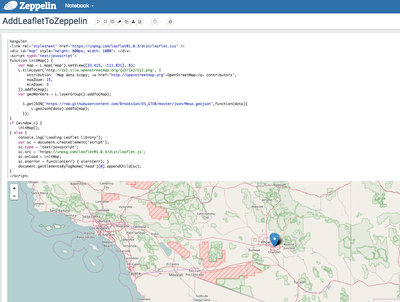
Step 3: Adding map markers from a GeoJSON file.

13933-screen-shot-2017-03-22-at-114441-am.png

Code Source:

%angular 
<link rel="stylesheet" href="https://unpkg.com/[email protected]/dist/leaflet.css" />
<div id="map" style="height: 800px; width: 100%"> </div>
<script type="text/javascript">
function initMap() {
    var map = L.map('map').setView([33.415, -111.831], 8);
    L.tileLayer('http://{s}.tile.openstreetmap.org/{z}/{x}/{y}.png', {
        attribution: 'Map data © <a href="http://openstreetmap.org">OpenStreetMap</a> contributors',
        maxZoom: 15,
        minZoom: 3
    }).addTo(map);
    var geoMarkers = L.layerGroup().addTo(map);
    
      $.getJSON("https://raw.githubusercontent.com/BrooksIan/DS_GTDB/master/json/Mesa.geojson",function(data){
          L.geoJson(data).addTo(map);
      });
}
if (window.L) {
    initMap();
} else {
    console.log('Loading Leaflet library');
    var sc = document.createElement('script');
    sc.type = 'text/javascript';
    sc.src='https://unpkg.com/[email protected]/dist/leaflet.js';
    sc.onload = initMap;
    sc.onerror = function(err) { alert(err); }
    document.getElementsByTagName('head')[0].appendChild(sc);
}
</script>

14,191 Views
Comments
avatar
Master Guru

have you connected to data from SQL?

avatar
Contributor

I haven't tried that yet. I have got markers from an existing file working at this point in time.

avatar
New Member

This is soooo cool!

avatar
New Member

I've found that in Zeppelin 0.7.0 the geoJSON needs to be obtained without credentials, otherwise an access control error results : "The value of the 'Access-Control-Allow-Origin' header in the response must not be the wildcard '*' when the request's credentials mode is 'include'" which is I guess new behaviour in Zeppelin.

As there doesn't seem to be a way to configure $.getJSON to do this, load it as follows :

$.ajax({ 
  url: "https://raw.githubusercontent.com/BrooksIan/DS_GTDB/master/json/Mesa.geojson",
  dataType: "json",
  xhrFields: { withCredentials: false }
})
.done( function( data ) {
  L.geoJson( data ).addTo( map );
});

Hope this helps, Simon

avatar
New Member

I've also found that a Zeppelin style hides any geoJSON boundary type overlays. The offending rule seems to be the following, removing this in chrome dev tools makes the overlay appear. YMMV...

..\zeppelin-web\src\app\notebook\paragraph\paragraph.css

.paragraph div svg {
    width: 100%;
}
Version history
Last update:
‎08-17-2019 01:41 PM
Updated by:
Contributors