Community Articles
- Cloudera Community
- Support
- Community Articles
- Identifying and tackling scale problems in Ambari ...
- Subscribe to RSS Feed
- Mark as New
- Mark as Read
- Bookmark
- Subscribe
- Printer Friendly Page
- Report Inappropriate Content
- Subscribe to RSS Feed
- Mark as New
- Mark as Read
- Bookmark
- Subscribe
- Printer Friendly Page
- Report Inappropriate Content
Created on 10-26-2017 08:10 PM - edited 08-17-2019 10:26 AM
Understanding scale issues in AMS (Why does it hapen)
The Metrics Collector component is the central daemon that receives metrics from ALL the service sinks and monitors that sends metrics. The collector uses HBase as its store and phoenix as the data accessor layer.
In a high level, the metrics collector performs 2 operations related to scale in a continuos basis.
- Handle raw writes - A raw write is a bunch of metric data points received from services written onto HBase through phoenix. There is no read or aggregation involved.
- Periodically aggregate data - AMS aggregates data across cluster and across time.
- Cluster Aggregator - Computing the min,max,avg and sum of memory across all hosts is done by a cluster aggregator. This is called a 'TimelineClusterAggregatorSecond' which runs every 2 mins. In every run it reads the entire last 2 mins data and calculates aggregates and writes back. The read is expensive since it has to read non-aggregated data, while the write volume is smaller since it is aggregated data. For example, in a 100 node cluster, mem_free from 100 hosts becomes 1 aggregate metric value in this aggregator.
- Time Aggregator - Also called 'downsampling', this aggregator rolls up the data in the time dimension. This helps AMS TTL out smaller precision seconds data and hold aggregate data for a longer time. For example, if we have data point for every 10 seconds, the 5min time aggregator takes the 30 data points every 5 mins and creates 1 rolled up value. There are higher level downsamplers (1hour, 1day) as well, and they use their immediate predecessors data (1hr => 5mins, 1day => 1hr ). However, it is the 5min aggregator that is high compute since it reads the entire last 5 mins data and downsamples it. Again, the read is very expensive since it has to read non-aggregated data, while the write volume is smaller. This downsampler is called 'TimelineHostAggregatorMinute'
Scale problems occur in AMS when one or both of the above operations cannot happen smoothly. The 'load' on AMS is decided based on following factors
- How many hosts in the cluster?
- How many metrics each component is sending to AMS?
Either of the above can cause performance issues in AMS.
How do we find out if AMS is experiencing scale problems?
One or more of the following consequences can be seen on the cluster.
- Metrics Collector shuts down intermittently. Since Auto Restart is enabled for Metrics collector by default, this will up show as an alert stating 'Metrics collector has been auto restarted # times the last 1 hour'.
- Partial metrics data is seen.
- All non-aggregated host metrics are seen (HDFS Namenode metrics / Host summary page on Ambari / System - Servers Grafana dashboard).
- Aggregated data is not seen. (AMS Summary page / System - Home Grafana dashboard / HBase - Home Grafana dashboard).
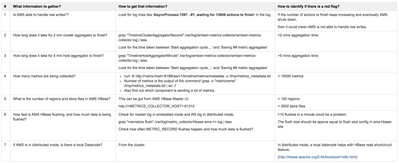
Step 1 : Get the current state of the system
Fixing / Recovering from the problem.
The above problems could occur because of a 2-3 underlying reasons.
| Underlying Problem | What it could cause | Fix / Workaround |
|---|---|---|
| Too many metrics (#4 from above) | It could cause ALL of the problems mentioned above. | #1 : Trying out config changes
#2 : Reducing number of metrics If the above config changes do not increase AMS stability, you can whitelist selected metrics or blacklist certain components' metrics that are causing the load issue.
|
|
AMS node has slow disk speed. Disk is not able to keep up with high volume data. | It can cause raw writes and aggregation problems. |
|
| Known issues around HBase normalier and FIFO compaction. Documented in Known Issues (#11 and #13) | This can be identified in #5 in the above table. | Follow workaround steps in Known issue doc. |
Other Advanced Configurations
| Configuration | Property | Description | Minimum Recommended values (Host Count => MB) |
|---|---|---|---|
| ams-site | phoenix.query.maxGlobalMemoryPercentage | Percentage of total heap memory used by Phoenix threads in the Metrics Collector API/Aggregator daemon. | 20 - 30, based on available memory. Default = 25. |
| ams-site | phoenix.spool.directory | Set directory for Phoenix spill files. (Client side) | Set this to different disk from hbase.rootdir dir if possible. |
| ams-hbase-site | phoenix.spool.directory | Set directory for Phoenix spill files. (Server side) | Set this to different disk from hbase.rootdir dir if possible. |
| ams-hbase-site | phoenix.query.spoolThresholdBytes | Threshold size in bytes after which results from parallelly executed query results are spooled to disk. | Set this to higher value based on available memory. Default is 12 mb. |


