Community Articles
- Cloudera Community
- Support
- Community Articles
- Monitoring Spark 2 performance via Grafana in Amba...
- Subscribe to RSS Feed
- Mark as New
- Mark as Read
- Bookmark
- Subscribe
- Printer Friendly Page
- Report Inappropriate Content
- Subscribe to RSS Feed
- Mark as New
- Mark as Read
- Bookmark
- Subscribe
- Printer Friendly Page
- Report Inappropriate Content
Created on 09-12-2018 09:52 AM - edited 08-17-2019 06:20 AM
Short Description:
This article covers steps on adding a Spark 2 Dashboard to Grafana in Ambari-Metrics, in order to monitor Spark applications for detailed resource usage statistics.
Article
Monitoring Spark 2 Performance via Grafana in Ambari-Metrics
- Configuration of Advanced spark2-metrics-properties
- Adding a new data source to Grafana
- Building a Spark 2 dashboard in Grafana
- You are running HDP 2.6.4 or higher, with Spark2
and Ambari-Metrics installed.
- A standalone Grafana installation may be used instead of Ambari-Metrics.
- A time-series database with support for the graphite protocol.
- In this article, I will be use Graphite.
Alternatively, Prometheus with the graphite-exporter plugin can be used depending on personal preference.
Pre-Requisites
Steps
In order for Spark components to forward metrics to our time-series
database, we need to add a few items to our configuration in Ambari ->
Spark2 -> Configs -> Advanced spark2-metrics-properties.
A restart of the Spark2 service is required for our new metrics properties to take
effect. We don’t need to include any references to these properties when
submitting spark jobs as the metrics properties are included by default for any
new jobs. I am using the configuration below, with a sink interval of 30
seconds. You can adjust the *.sink.graphite.period to your needs, with a
minimum
value of 1. For long running applications I found 30 seconds to be
sufficient.
Here are the metrics.properties that I am using for this setup:
*.sink.graphite.class=org.apache.spark.metrics.sink.GraphiteSink
*.sink.graphite.protocol=tcp
*.sink.graphite.host=172.0.0.1
*.sink.graphite.port=2003
*.source.jvm.class=org.apache.spark.metrics.source.JvmSource
*.sink.graphite.period=30
*.sink.graphite.unit=seconds
master.source.jvm.class=org.apache.spark.metrics.source.JvmSource
worker.source.jvm.class=org.apache.spark.metrics.source.JvmSource
driver.source.jvm.class=org.apache.spark.metrics.source.JvmSource
executor.source.jvm.class=org.apache.spark.metrics.source.JvmSource
In the above sample, please adjust the graphite.host and graphite.port for your Graphite host and Carbon-Cache plaintext port (default port 2003).
Before we add our new source to Grafana, let’s make sure we have some data available in Graphite. Kick off your usual spark jobs or alternatively we can generate some data using the example jars. I will be using spark terasort jobs for the next step as I want my spark jobs to generate some HDFS read & writes.
If you have a terasort jar built, you may follow the example that I'm using below. Please note that this sample will generate 20GB of data in /home/hdfs. You can adjust the size or the directory. I have a small cluster with several worker nodes, so I'm using the cluster deploy-mode.
/usr/bin/spark-submit --class com.github.ehiggs.spark.terasort.TeraGen --master yarn --deploy-mode cluster \
--num-executors 3 --executor-memory 2G /mvn/spark-terasort/target/spark-terasort-1.1-SNAPSHOT.jar 20g /home/hdfs
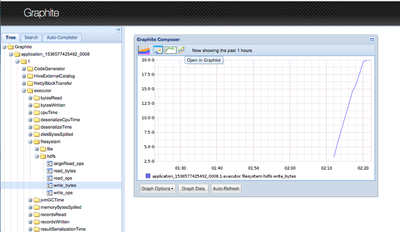
Within a few moments of submitting this job, we can see my application showing up in the tree section of the Graphite web UI. When I select the write_bytes of my executor, you can see that it has already finished writing the 20GB of data:
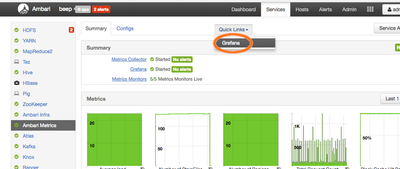
Let’s get this data showing on our Ambari-Metrics Grafana instance, so we have everything in one place. We will have to add this Graphite instance a new data source to our Grafana instance. Let’s open Grafana, via Ambari -> Ambari Metrics and selecting Grafana from the Quick Links dropdown.
Once in the Grafana UI, hit “sign in” on the left-hand side. Login as the Grafana Admin user. If you have lost the Grafana Admin credentials, they can be changed in the General Config section of Ambari-Metrics through Ambari.
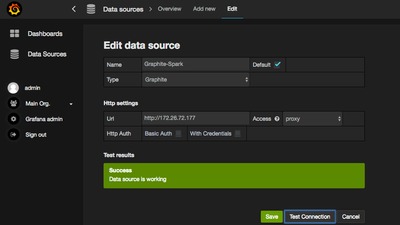
Now that we are logged in to Grafana, we will add our new Graphite data source before we can build a dashboard for our new spark metrics. Select to Data Sources on the left-hand side and select “Add new” in the top of the screen. Here I am adding my “Graphite-Spark” source with Type Graphite. I did not add any authentication to Graphite, so my Http Auth section is left empty. Access is set to direct. After you click Save, the option “Test Connection” will be available.
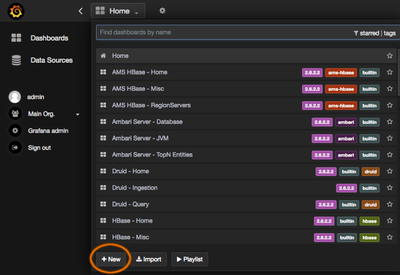
Now we are ready to add our Spark Dashboard. On the left menu in Grafana, select "Dashboards" and then on the “Home” dropdown in the top, we will see the “+New” option as is shown here;
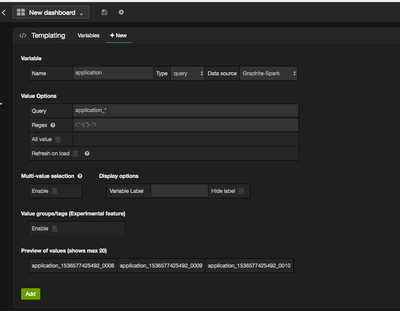
Go ahead and hit the '+New' button to start a new dashboard. The first thing we will do on our new dashboard is adding a Templating system. With the templating system, we can select the application through a dropdown menu in order to better filter the graphs down to a single application at a time, otherwise it will be difficult to keep an overview when multiple spark applications are running at the same time. Below is the templating configuration that I'm using, with the simple Query "application_*", in the preview at the bottom we can verify that this extracts our application IDs which will populate the dropdown;
I'm also changing the name for my dashboard from "New dashboard" to "Spark-Graphite-Dashboard" under Settings;
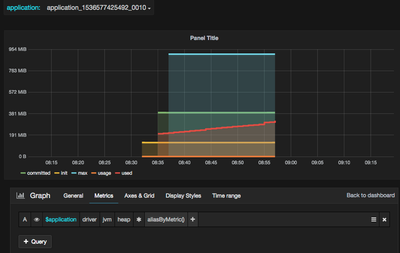
You’ll also notice we have a drop-down menu where we can select the application we are investigating, resulting from our templating setup. We can now move on to adding the first graph. Let’s make it something useful, say I want to monitor the JVM statistics of the application driver, I can make a graph using $application (from our templating) driver – jvm – heap – * with aliasByMetric(). I have also set the left Y axis to “bytes” under Axes & Grid, to make the size easier to read. You should also make sure that you have selected the correct data source (Graphite-Spark in my case). The result and Query setup looks like this:
Since our spark application is also generating files in HDFS, I want to monitor the amount of data written by my spark application. I can do that with the following example below. Note that we have to ensure we select the right data source for the graph in the bottom right side:
This graph shows me how much data has been written by whichever application variable selected in the “application” drop down menu of the dashboard. You may also use write_ops for the IOPS figure or substitute write with read to have the read statistics.
We are now set up with our new datasource and example graphs to get started!
Created on 09-12-2018 09:55 AM
- Mark as Read
- Mark as New
- Bookmark
- Permalink
- Report Inappropriate Content
Created on 09-12-2018 09:56 AM
- Mark as Read
- Mark as New
- Bookmark
- Permalink
- Report Inappropriate Content
Thank you @Jay Kumar SenSharma ! 🙂
Created on 09-12-2018 09:58 AM
- Mark as Read
- Mark as New
- Bookmark
- Permalink
- Report Inappropriate Content
Great one @Jonathan Sneep
Created on 09-12-2018 10:00 AM
- Mark as Read
- Mark as New
- Bookmark
- Permalink
- Report Inappropriate Content
@Sandeep Nemuri Thank you sir!
Created on 02-28-2020 05:06 AM
- Mark as Read
- Mark as New
- Bookmark
- Permalink
- Report Inappropriate Content
In CDH 6.X I can't find Advanced spark2-metrics-properties in Spark config. Should I create manually?
Created on 03-30-2021 11:28 AM
- Mark as Read
- Mark as New
- Bookmark
- Permalink
- Report Inappropriate Content
@Jona
Great article...may i ask can you use "custom spark2-metrics-properties" in spark config instead of advanced spark2-metrics-properties?
