Our Community is getting an upgrade! To get everything ready for the relaunch, we’ll be placing the site in read-only mode starting September 21st. We really appreciate your understanding while we get things set up behind the scenes. Catch up on all the exciting details about the move here. Need help or have questions? Drop us a line at [email protected]
4. Install R and then verify the installation of RStudio
yum install -y R
yum -y install libcurl-devel
rstudio-server verify-installation
5. The default port of RStudio server is 8787 which is not opened in the Docker Sandbox. You can either add it by following this tutorial or just edit rserver.conf file to change the port to another which is opened. Let us edit the rserver.conf file, run the following sed command:
sed -i "1 a www-port=8090" /etc/rstudio/rserver.conf
6. Restart the server by typing
exec /usr/lib/rstudio-server/bin/rserver
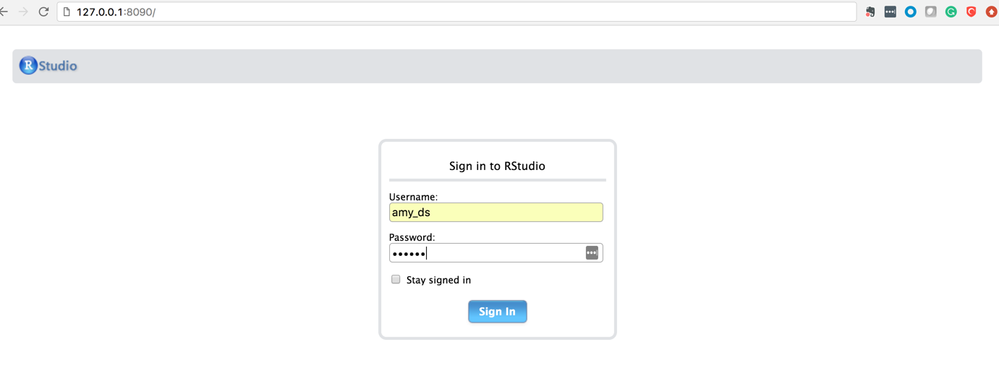
It will take you out from the docker shell but you can re-login. Go to browser anyway and access RStudio by typing 127.0.0.1:8090. The login page will appear, use user credentials amy_ds/amy_ds.
I am unable to see any plots or graphs when I run a chunk of code in RNoteBook. But I am able to see them in the plots pane, when I run it from the console. What could be the reason for this behavior?