Community Articles
- Cloudera Community
- Support
- Community Articles
- Troubleshooting missing events in Metron quick-dev...
- Subscribe to RSS Feed
- Mark as New
- Mark as Read
- Bookmark
- Subscribe
- Printer Friendly Page
- Report Inappropriate Content
- Subscribe to RSS Feed
- Mark as New
- Mark as Read
- Bookmark
- Subscribe
- Printer Friendly Page
- Report Inappropriate Content
Objective
This tutorial is intended to walk you through the process of troubleshooting why events are missing from the Metron Kibana dashboard when using the quick-dev-platform. Because of the constrained resources and added complexity of the virtualized environment, sometimes the vagrant instance doesn't come up in a healthy state.
Prerequisites
- You should have already cloned the Metron git repo. Metron
- You should have already deployed the Metron quick-dev-platform. quick-dev-platform
- The expectation is you have already started Metron once and shut it down via a
vagrant halt. Now you are trying to start Metron again viavagrant up, but things don't seem to be working properly. These troubleshooting steps are also be helpful during the initial start of the VM via the run.sh script.
Scope
Theses troubleshooting steps were performed in the following environment:
- Mac OS X 10.11.6
- Vagrant 1.8.6
- VirtualBox 5.1.6
- Python 2.7.12 (Anaconda distribution)
Steps
Start Metron quick-dev-platform
You should be in the /incubator-metron/metron-deployment/vagrant/quick-dev-platform directory.
$ cd <basedir>/incubator-metron/metron-deployment/vagrant/quick-dev-platform
Now you can run vagrant up to start the Metron virtual machine. You should see something similar to this:
$ vagrant up
Bringing machine 'node1' up with 'virtualbox' provider...
==> node1: Checking if box 'metron/hdp-base' is up to date...
==> node1: Clearing any previously set forwarded ports...
==> node1: Clearing any previously set network interfaces...
==> node1: Preparing network interfaces based on configuration...
    node1: Adapter 1: nat
    node1: Adapter 2: hostonly
==> node1: Forwarding ports...
    node1: 22 (guest) => 2222 (host) (adapter 1)
==> node1: Running 'pre-boot' VM customizations...
==> node1: Booting VM...
==> node1: Waiting for machine to boot. This may take a few minutes...
    node1: SSH address: 127.0.0.1:2222
    node1: SSH username: vagrant
    node1: SSH auth method: private key
    node1: Warning: Remote connection disconnect. Retrying...
==> node1: Machine booted and ready!
[node1] GuestAdditions 5.1.6 running --- OK.
==> node1: Checking for guest additions in VM...
==> node1: Setting hostname...
==> node1: Configuring and enabling network interfaces...
==> node1: Mounting shared folders...
    node1: /vagrant => /Volumes/Samsung/Development/incubator-metron/metron-deployment/vagrant/quick-dev-platform
==> node1: Updating /etc/hosts file on active guest machines...
==> node1: Updating /etc/hosts file on host machine (password may be required)...
==> node1: Machine already provisioned. Run `vagrant provision` or use the `--provision`
==> node1: flag to force provisioning. Provisioners marked to run always will still run.
Connect to Vagrant virtual machine
Now that the virtual machine is running, we can connect to it with vagrant ssh.
You should see something similar to this:
$ vagrant ssh
Last login: Tue Oct  4 14:54:04 2016 from 10.0.2.2
[vagrant@node1 ~]$
Check Ambari
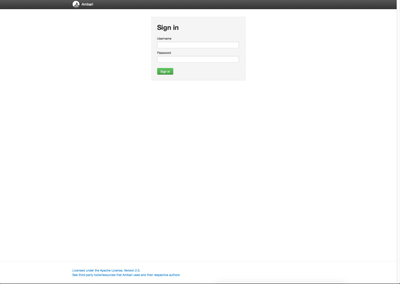
The Ambari UI should be available at http://node1:8080. Ambari should present you with a login screen.
NOTE: The vagrant hostmanager plugin should automatically update the /etc/hosts file on your local machine to add a node1 entry
You should see something similar to this:
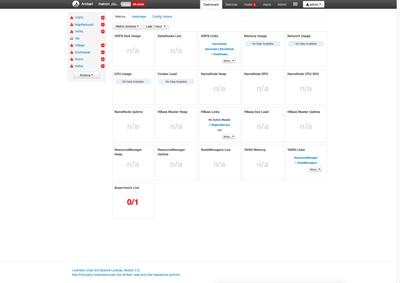
You should be able to log into the interface using admin as the username and password. You should see something similar to this:
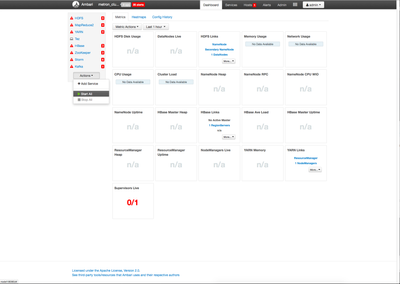
You should notice that all of the services are red. They do not auto start. Click the Actions button and then the Start All link. You should see something similar to this:
You should see a confirmation dialog similar to this:
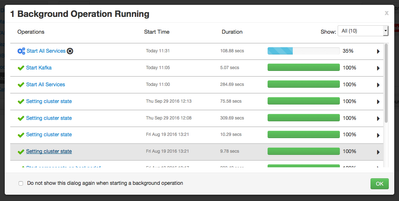
Click the green confirm button. You should see an operations dialog showing you the status of the start all process. You should see something similar to this:
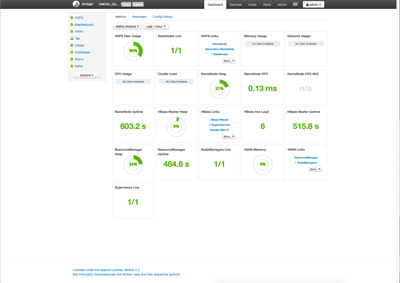
Click the green OK button and wait for the processes to finish starting. Once the startup process is complete, you should see something similar to this:
Check Kibana dashboard
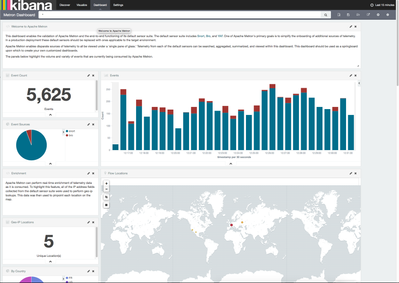
Now that the cluster is running, we want to check our Kibana dashboard to see if there are any events. The Kibana dashboard should be available at http://node1:5000.
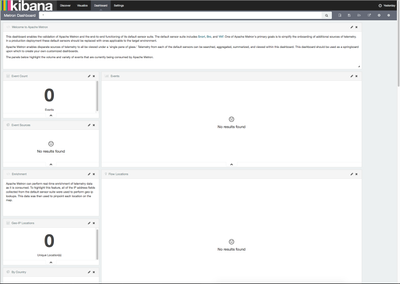
The dashboard should present you with both bro and snort events. It may take a few minutes before events show up. If there are no events, then you should see something similar to this:
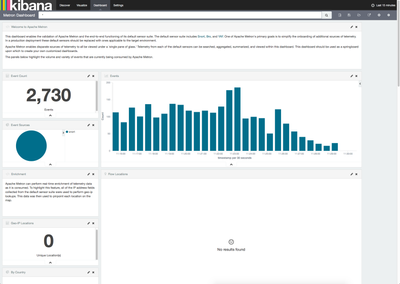
If you see only one type of events, such as snort, then you should see something like this:
Seeing either versions of these dashboards after 5-10 minutes indicates there is a problem with the data flow.
Check monit dashboard
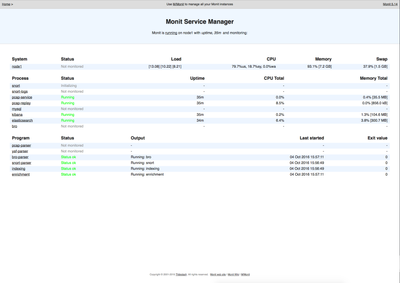
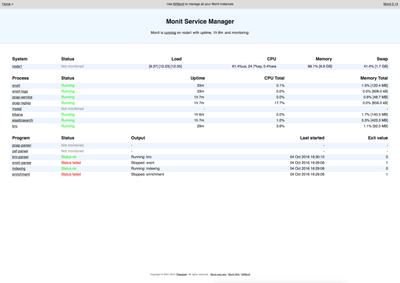
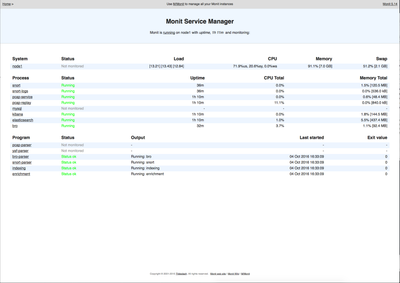
The first thing you can do is check the monit dashboard. It should be available at 'http://node1:2812'. You should be presented with a login dialog. The username is admin and the password is monit. You should see something similar to this:
If you are unable to access the monit dashboard ui, try using the command-line. The monit command requires sudo.
You should see something similar to this:
$ sudo monit status
The Monit daemon 5.14 uptime: 25m
Process 'snort'
  status                            Not monitored
  monitoring status                 Not monitored
  data collected                    Tue, 04 Oct 2016 15:22:12
Process 'snort-logs'
  status                            Not monitored
  monitoring status                 Not monitored
  data collected                    Tue, 04 Oct 2016 15:22:12
Process 'pcap-service'
  status                            Running
  monitoring status                 Monitored
  pid                               3974
  parent pid                        1
  uid                               0
  effective uid                     0
  gid                               0
  uptime                            25m
  children                          0
  memory                            34.3 MB
  memory total                      34.3 MB
  memory percent                    0.4%
  memory percent total              0.4%
  cpu percent                       0.0%
  cpu percent total                 0.0%
  data collected                    Tue, 04 Oct 2016 15:47:25
Process 'pcap-replay'
  status                            Running
  monitoring status                 Monitored
  pid                               4024
  parent pid                        1
  uid                               0
  effective uid                     0
  gid                               0
  uptime                            25m
  children                          0
  memory                            856.0 kB
  memory total                      856.0 kB
  memory percent                    0.0%
  memory percent total              0.0%
  cpu percent                       14.5%
  cpu percent total                 14.5%
  data collected                    Tue, 04 Oct 2016 15:47:25
Program 'pcap-parser'
  status                            Not monitored
  monitoring status                 Not monitored
  data collected                    Tue, 04 Oct 2016 15:22:12
Program 'yaf-parser'
  status                            Not monitored
  monitoring status                 Not monitored
  data collected                    Tue, 04 Oct 2016 15:22:12
Program 'bro-parser'
  status                            Status ok
  monitoring status                 Monitored
  last started                      Tue, 04 Oct 2016 15:47:25
  last exit value                   0
  data collected                    Tue, 04 Oct 2016 15:47:25
Program 'snort-parser'
  status                            Status ok
  monitoring status                 Monitored
  last started                      Tue, 04 Oct 2016 15:47:25
  last exit value                   0
  data collected                    Tue, 04 Oct 2016 15:47:25
Process 'mysql'
  status                            Not monitored
  monitoring status                 Not monitored
  data collected                    Tue, 04 Oct 2016 15:22:12
Process 'kibana'
  status                            Running
  monitoring status                 Monitored
  pid                               4052
  parent pid                        1
  uid                               496
  effective uid                     496
  gid                               0
  uptime                            25m
  children                          0
  memory                            99.0 MB
  memory total                      99.0 MB
  memory percent                    1.2%
  memory percent total              1.2%
  cpu percent                       0.0%
  cpu percent total                 0.0%
  data collected                    Tue, 04 Oct 2016 15:47:25
Program 'indexing'
  status                            Status ok
  monitoring status                 Monitored
  last started                      Tue, 04 Oct 2016 15:47:25
  last exit value                   0
  data collected                    Tue, 04 Oct 2016 15:47:25
Program 'enrichment'
  status                            Status ok
  monitoring status                 Monitored
  last started                      Tue, 04 Oct 2016 15:47:25
  last exit value                   0
  data collected                    Tue, 04 Oct 2016 15:47:25
Process 'elasticsearch'
  status                            Running
  monitoring status                 Monitored
  pid                               4180
  parent pid                        1
  uid                               497
  effective uid                     497
  gid                               491
  uptime                            25m
  children                          0
  memory                            210.7 MB
  memory total                      210.7 MB
  memory percent                    2.6%
  memory percent total              2.6%
  cpu percent                       0.1%
  cpu percent total                 0.1%
  data collected                    Tue, 04 Oct 2016 15:47:25
Process 'bro'
  status                            Not monitored
  monitoring status                 Not monitored
  data collected                    Tue, 04 Oct 2016 15:22:12
System 'node1'
  status                            Not monitored
  monitoring status                 Not monitored
  data collected                    Tue, 04 Oct 2016 15:22:12
If you see something like this:
$ sudo monit status
Cannot create socket to [node1]:2812 -- Connection refused
Then check to make sure that monit is running:
$ sudo service monit status
monit (pid  3981) is running...
If the service is running, but you can't access the web user interface or the command line, then you should restart the service.
$ sudo service monit restart
Shutting down monit:                                       [  OK  ]
Starting monit:                                            [  OK  ]
Now verify you can access the monit web ui. If you see any of the items under Process listed as Not Monitored, then we should start those processes.
Note: The vagrant image is using vagrant hostmanager to automatically update the the /etc/hosts file on both the host and the guest. If monit still does not restart properly, check the /etc/hosts file on node1. If you see:
127.0.0.1 node1 node1
on the first line of your /etc/hosts file, comment out or delete that line.
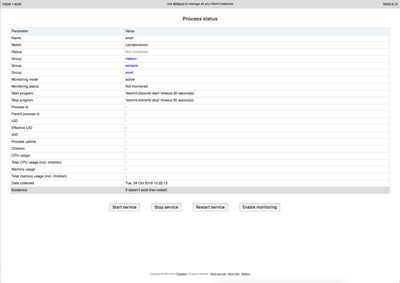
In my example, I can see that snort,snort-logs, bro processes are not running. I'm going to start them by clicking on the name of the process which will bring up a new view similar to this:
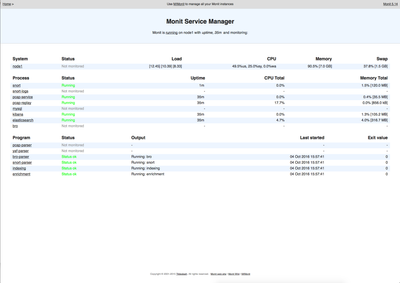
First click the Enable Monitoring button. The status should change to Not monitored - monitor pending. Click the Home link in the upper left of the monit dashboard. This takes you back to the main monit dashboard. You should see something similar to this:
Once the process has initialized, you should see something similar to this:
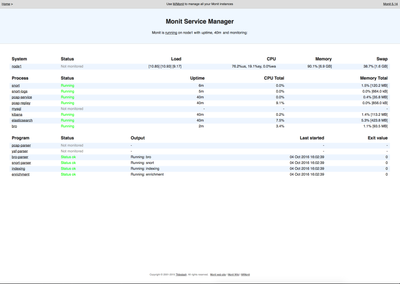
Repeat this process for the snort-logs and bro processes. Once that is complete, the monit dashboard should look similar to this:
Recheck the Kibana dashboard
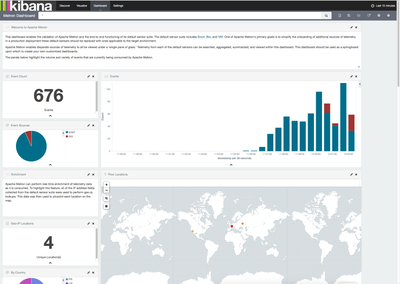
Now recheck the Kibana dashboard to see if there are new events. You should see something similar to this:
If you do not see this, then we need to continue troubleshooting.
Check Kafka topics
First we need to make sure that all of our Kafka topics are up. You can verify by doing the following:
$ cd /usr/hdp/current/kafka-broker
$ ./bin/kafka-topics.sh --list --zookeeper localhost:2181
You should see something similar to this:
$ ./bin/kafka-topics.sh --list --zookeeper localhost:2181
bro
enrichments
indexing
indexing_error
parser_error
parser_invalid
pcap
snort
yaf
We have verified the topics exist. So let's see if any data is coming through the topics. First we'll check the bro topic.
$ ./bin/kafka-console-consumer.sh --topic bro --zookeeper localhost:2181
You should see something similar to this:
$ ./bin/kafka-console-consumer.sh --topic bro --zookeeper localhost:2181
{metadata.broker.list=node1:6667, request.timeout.ms=30000, client.id=console-consumer-21240, security.protocol=PLAINTEXT}
{"dns": {"ts":1475597283.245551,"uid":"CffpQZ36hz1gmVzj0a","id.orig_h":"192.168.66.1","id.orig_p":5353,"id.resp_h":"224.#.#.#","id.resp_p":5353,"proto":"udp","trans_id":0,"query":"hp envy 7640 series [c62abe]._uscan._tcp.local","qclass":32769,"qclass_name":"qclass-32769","qtype":33,"qtype_name":"SRV","AA":false,"TC":false,"RD":false,"RA":false,"Z":0,"rejected":false}}
It may take a few seconds before a message is shown. If you are seeing messages, then the bro topic is working ok. Press ctrl-c to exit.
Now let's check the snort topic.
$ ./bin/kafka-console-consumer.sh --topic snort --zookeeper localhost:2181
You should see something similar to this:
$ ./bin/kafka-console-consumer.sh --topic snort --zookeeper localhost:2181
{metadata.broker.list=node1:6667, request.timeout.ms=30000, client.id=console-consumer-73857, security.protocol=PLAINTEXT}
10/04-16:09:18.045368 ,1,999158,0,"'snort test alert'",TCP,192.168.138.158,49206,95.163.121.204,80,00:00:00:00:00:00,00:00:00:00:00:00,0x3C,***A****,0xA80DAF97,0xB93A1E6C,,0xFAF0,128,0,2556,40,40960,,,,
10/04-16:09:18.114314 ,1,999158,0,"'snort test alert'",TCP,95.#.#.#,80,192.168.138.158,49205,00:00:00:00:00:00,00:00:00:00:00:00,0x221,***AP***,0x628EE92,0xCA8D8698,,0xFAF0,128,0,2031,531,19464,,,,
10/04-16:09:18.185913 ,1,999158,0,"'snort test alert'",TCP,95.#.#.#,80,192.168.138.158,49210,00:00:00:00:00:00,00:00:00:00:00:00,0x21E,***AP***,0x9B7A5871,0x63626DD7,,0xFAF0,128,0,2032,528,16392,,,,
10/04-16:09:18.216988 ,1,999158,0,"'snort test alert'",TCP,192.168.138.158,49205,95.#.#.#,80,00:00:00:00:00:00,00:00:00:00:00:00,0x3C,***A****,0xCA8D8698,0x628F07D,,0xFAF0,128,0,2557,40,40960,,,,
10/04-16:09:18.292182 ,1,999158,0,"'snort test alert'",TCP,192.168.138.158,49210,95.#.#.#,80,00:00:00:00:00:00,00:00:00:00:00:00,0x3C,***A****,0x63626DD7,0x9B7A5A59,,0xF71F,128,0,2558,40,40960,,,,
10/04-16:09:18.310822 ,1,999158,0,"'snort test alert'",TCP,95.#.#.#,80.#.#.#.158,49208,00:00:00:00:00:00,00:00:00:00:00:00,0x21C,***AP***,0x8EF414C5,0xBE149917,,0xFAF0,128,0,2035,526,14344,,,,
It may take a few seconds before a message is shown. If you are seeing messages, then the snort topic is working ok. Press ctrl-c to exit.
Check MySQL
If MySQL is not running, then you will have issues seeing events in your Kibana dashboard. The first thing to do is see if it's running:
$ sudo service mysqld status
You should see something similar ot this:
$ sudo service mysqld status
mysqld (pid  1916) is running...
If it is not running, then you need to start it with:
$ sudo service mysqld start
Even if it is running, you may want to restart it.
$ sudo service mysqld restart
Stopping mysqld:                                           [  OK  ]
Starting mysqld:                                           [  OK  ]
Check Storm topologies
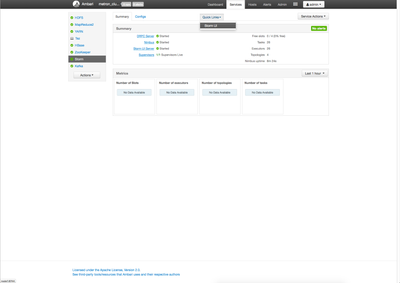
If there were issues with MySQL or you restarted it, you will need to reset the enrichment Storm topology. You may also want to reset the bro and snort typologies. From the Ambari user interface, click on the Storm service. You should see something similar to this:
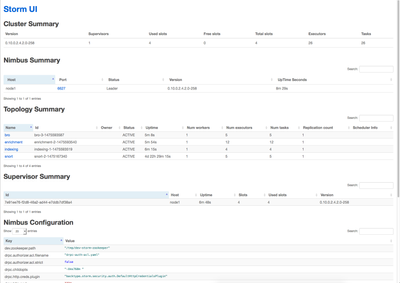
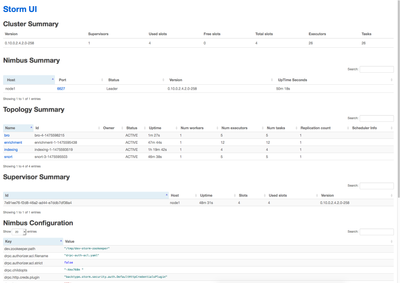
In the quick links section, click on the Storm UI link. You should see something similar to this:
Under the Topology Summary section, there should be at least 4 topology entries: bro, enrichment, indexing, and snort
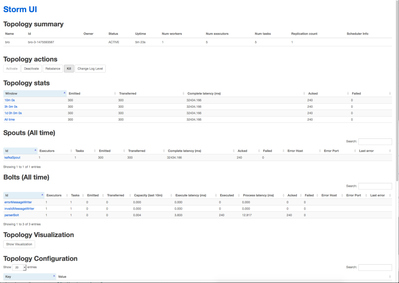
Click on the bro link. You should see something similar to this:
You should see events in the Topology stats section under the Acked column. Under the Spouts and Bolts sections, you should see events under the Acked column for the kafkaSpout and parserBolt respectively.
Under Topology actions, click on the kill button. This will kill the topology. The monit process should automatically restart the topology.
You should see a dialog asking you for a delay value in seconds, something similar to this:
The delay defaults to 30 seconds. You can set it to a smaller number, like 5. Then click the ok button.
Go back to the main Storm UI page. You should see something similar to this:
You should notice the bro topology is now missing. Now take a look at the monit dashboard. You should see something similar to this:
You may notice several programs listed as Status:failed. After a few seconds, monit will restart the topologies. You should see something similar to this:
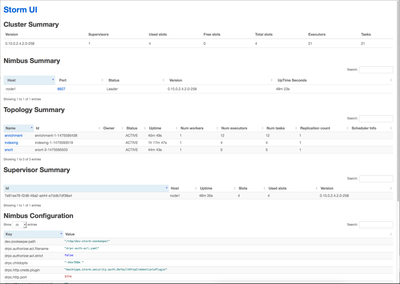
Now go back to the Storm UI. You should see something similar to this:
You should notice the bro topology is back and it has an uptime less than the other topologies.
You can repeat this process for each of the topologies.
Recheck Kibana dashboard
Now we can recheck our Kibana dashboard. You should see something similar to this:
Now you events running through the Metron stack.
Review
We walked through some common troubleshooting steps in Metron when replay events are not being displayed in the Kibana dashboard. More often than not, the MySQL server is the culprit because it doesn't always come up cleanly when you do a vagrant up. That will impact the Storm topologies, particularly the enrichment topology.
Created on 10-10-2016 08:09 AM
- Mark as Read
- Mark as New
- Bookmark
- Permalink
- Report Inappropriate Content
This is a well written article, very useful indeed. Thank you, @Michael Young!
Created on 01-12-2017 04:58 AM
- Mark as Read
- Mark as New
- Bookmark
- Permalink
- Report Inappropriate Content
Hi @Michael Young, Thanks for this detailed and amazing post. However, I am still having issues in monit UI could you please help me HERE, I am using ubuntu server 16.04 lts, Thanks!
Created on 01-12-2017 05:07 AM
- Mark as Read
- Mark as New
- Bookmark
- Permalink
- Report Inappropriate Content
Created on 01-12-2017 05:24 AM
- Mark as Read
- Mark as New
- Bookmark
- Permalink
- Report Inappropriate Content
However I am indexing is failing in monit, any suggestions for that? thanks!
