Support Questions
- Cloudera Community
- Support
- Support Questions
- Re: Ambari 2.6.* - Amabri Metrics UI is not loadin...
- Subscribe to RSS Feed
- Mark Question as New
- Mark Question as Read
- Float this Question for Current User
- Bookmark
- Subscribe
- Mute
- Printer Friendly Page
- Subscribe to RSS Feed
- Mark Question as New
- Mark Question as Read
- Float this Question for Current User
- Bookmark
- Subscribe
- Mute
- Printer Friendly Page
Ambari 2.6.* - Amabri Metrics UI is not loading information
- Labels:
-
Apache Ambari
Created 05-16-2018 09:08 PM
- Mark as New
- Bookmark
- Subscribe
- Mute
- Subscribe to RSS Feed
- Permalink
- Report Inappropriate Content
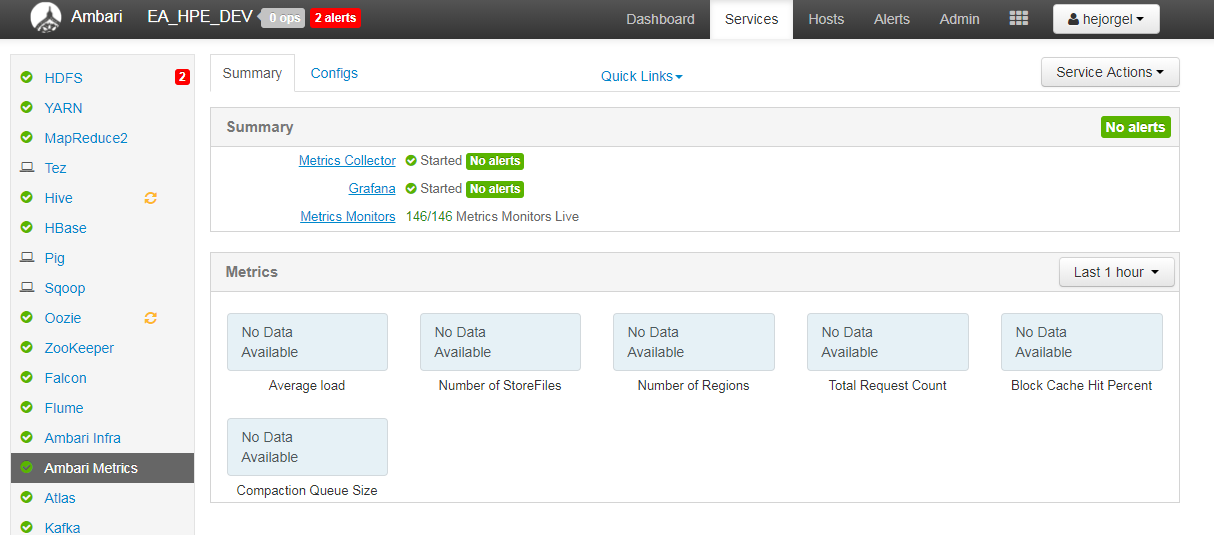
Problem: Amabri metrics dashboard within Ambari is not loading information (image attached)
Actions: Ambari metrics service restart, Ambari collector restart.
Also Ive founded this message on the logs. Therefore, I am trying to get mentioned server out from blacklist but I can't find information about it.
2018-05-16 20:32:17,258 [WARNING] emitter.py:146 - Error sending metrics to server.
2018-05-16 20:32:17,258 [WARNING] emitter.py:111 - Retrying after 5 ...
2018-05-16 20:35:42,259 [WARNING] emitter.py:146 - Error sending metrics to server. ''
2018-05-16 20:35:42,260 [WARNING] emitter.py:111 - Retrying after 5 ...
2018-05-16 20:35:47,260 [WARNING] emitter.py:120 - Metric collector host <server_name> was blacklisted.
2018-05-16 20:35:47,260 [INFO] emitter.py:96 - No valid collectors found...
2018-05-16 20:36:47,269 [INFO] emitter.py:96 - No valid collectors found...
2018-05-16 20:37:47,273 [INFO] emitter.py:96 - No valid collectors found...
2018-05-16 20:38:47,276 [INFO] emitter.py:96 - No valid collectors found...
2018-05-16 20:39:47,280 [INFO] emitter.py:96 - No valid collectors found...
2018-05-16 20:40:47,283 [INFO] emitter.py:154 - Calculated collector shard based on hostname : <server_name>
2018-05-16 20:44:07,284 [WARNING] emitter.py:146 - Error sending metrics to server. ''
2018-05-16 20:44:07,285 [WARNING] emitter.py:111 - Retrying after 5 ...
2018-05-16 20:44:12,285 [WARNING] emitter.py:146 - Error sending metrics to server.
2018-05-16 20:44:12,285 [WARNING] emitter.py:111 - Retrying after 5 ...
2018-05-16 20:47:37,286 [WARNING] emitter.py:146 - Error sending metrics to server. ''
2018-05-16 20:47:37,287 [WARNING] emitter.py:111 - Retrying after 5 ...
Created on 05-16-2018 09:36 PM - edited 08-17-2019 11:09 PM
- Mark as New
- Bookmark
- Subscribe
- Mute
- Subscribe to RSS Feed
- Permalink
- Report Inappropriate Content
This is usually due to AMS Data being corrupt.
- Shut down Ambari Monitors, and Collector via Ambari
- Cleared out the /var/lib/ambari-metrics-collector dir for fresh restart
- From Ambari -> Ambari Metrics -> Config -> Advanced ams-hbase-site get the hbase.rootdir and hbase-tmp directory
- Delete or Move the hbase-tmp and hbase.rootdir directories to an archive folder
- Started AMS.
- All services will came online and graphs started to display, after a few minutes


Hope that helps
Created on 05-16-2018 09:36 PM - edited 08-17-2019 11:09 PM
- Mark as New
- Bookmark
- Subscribe
- Mute
- Subscribe to RSS Feed
- Permalink
- Report Inappropriate Content
This is usually due to AMS Data being corrupt.
- Shut down Ambari Monitors, and Collector via Ambari
- Cleared out the /var/lib/ambari-metrics-collector dir for fresh restart
- From Ambari -> Ambari Metrics -> Config -> Advanced ams-hbase-site get the hbase.rootdir and hbase-tmp directory
- Delete or Move the hbase-tmp and hbase.rootdir directories to an archive folder
- Started AMS.
- All services will came online and graphs started to display, after a few minutes
Hope that helps
Created 05-16-2018 10:02 PM
- Mark as New
- Bookmark
- Subscribe
- Mute
- Subscribe to RSS Feed
- Permalink
- Report Inappropriate Content
Thank you Geoffrey it works and now logs are behaving as expected adn dashboard as well.
Created 05-16-2018 11:37 PM
- Mark as New
- Bookmark
- Subscribe
- Mute
- Subscribe to RSS Feed
- Permalink
- Report Inappropriate Content
Hey Geoffrey eventhough it worked. I kept monitoring it for a while and metrics went away again, but this time with a different message
2018-05-16 22:53:52,754 INFO TimelineMetricHostAggregatorHourly: End aggregation cycle @ Wed May 16 22:53:52 UTC 2018
2018-05-16 22:54:10,428 INFO org.apache.hadoop.hbase.client.AsyncProcess: #1, waiting for 58080  actions to finish
2018-05-16 22:54:20,432 INFO org.apache.hadoop.hbase.client.AsyncProcess: #1, waiting for 58080  actions to finish
2018-05-16 22:54:30,437 INFO org.apache.hadoop.hbase.client.AsyncProcess: #1, waiting for 58080  actions to finish
2018-05-16 22:54:40,446 INFO org.apache.hadoop.hbase.client.AsyncProcess: #1, waiting for 58080  actions to finish
2018-05-16 22:54:45,499 INFO TimelineClusterAggregatorSecond: Started Timeline aggregator thread @ Wed May 16 22:54:45 UTC 2018
2018-05-16 22:54:45,501 INFO TimelineClusterAggregatorSecond: Last Checkpoint read : Wed May 16 22:52:00 UTC 2018
2018-05-16 22:54:45,501 INFO TimelineClusterAggregatorSecond: Rounded off checkpoint : Wed May 16 22:52:00 UTC 2018
2018-05-16 22:54:45,501 INFO TimelineClusterAggregatorSecond: Last check point time: 1526511120000, lagBy: 165 seconds.
2018-05-16 22:54:45,501 INFO TimelineClusterAggregatorSecond: Start aggregation cycle @ Wed May 16 22:54:45 UTC 2018, startTime = Wed May 16 22:52:00 UTC 2018, endTime = Wed May 16 22:54:00 UTC 2018
2018-05-16 22:54:45,501 INFO TimelineClusterAggregatorSecond: Skipping aggregation for metric patterns : sdisk\_%,boottime
2018-05-16 22:54:50,453 INFO org.apache.hadoop.hbase.client.AsyncProcess: #1, waiting for 58080  actions to finish
2018-05-16 22:55:00,460 INFO org.apache.hadoop.hbase.client.AsyncProcess: #1, waiting for 58080  actions to finish
2018-05-16 22:55:10,462 INFO org.apache.hadoop.hbase.client.AsyncProcess: #1, waiting for 58080  actions to finish
2018-05-16 22:55:20,463 INFO org.apache.hadoop.hbase.client.AsyncProcess: #1, waiting for 58080  actions to finish
2018-05-16 22:55:30,473 INFO org.apache.hadoop.hbase.client.AsyncProcess: #1, waiting for 58080  actions to finish
2018-05-16 22:55:40,476 INFO org.apache.hadoop.hbase.client.AsyncProcess: #1, waiting for 58080  actions to finish
2018-05-16 22:55:50,487 INFO org.apache.hadoop.hbase.client.AsyncProcess: #1, waiting for 58080  actions to finish
2018-05-16 22:56:00,490 INFO org.apache.hadoop.hbase.client.AsyncProcess: #1, waiting for 58080  actions to finish
2018-05-16 22:56:10,494 INFO org.apache.hadoop.hbase.client.AsyncProcess: #1, waiting for 58080  actions to finish


<br>
and it's showing above all time. Any idea?
I meant, the message is preatty clear and looks like my heap size is not enough for the amount of data the service is getting, this is what I have configure on my metrics collector heap size:
metrics_collector_heapsize = 6144
If I have a cluster with 126 node and 106 of them has 899.50 GB as configure capaciy ant 20 of them with 399.75 GB what would be a fair amount of heap size to assign to this service does a formula exists for this?
Regards!

