Support Questions
- Cloudera Community
- Support
- Support Questions
- Re: Hive memory stuffing
- Subscribe to RSS Feed
- Mark Question as New
- Mark Question as Read
- Float this Question for Current User
- Bookmark
- Subscribe
- Mute
- Printer Friendly Page
- Subscribe to RSS Feed
- Mark Question as New
- Mark Question as Read
- Float this Question for Current User
- Bookmark
- Subscribe
- Mute
- Printer Friendly Page
Hive memory stuffing
Created 09-28-2021 02:43 AM
- Mark as New
- Bookmark
- Subscribe
- Mute
- Subscribe to RSS Feed
- Permalink
- Report Inappropriate Content
We have an hdp cluster 2.6.5, hive service is installed with HA
3 Hive server
3 Metastores
1 HiveServer2 Interactive
1 WebHCat Server
We are receiving "memory high usage" alerts from our monitoring tool, when i check the memory consumption on that nodes i can see that hive is consuming more than 80% of memory node
When memory usage reach 98%, the hive server crash with the following error message
[root@mnode4 hive]# head -n 20 hs_err_pid27508.log
#
# There is insufficient memory for the Java Runtime Environment to continue.
# Native memory allocation (mmap) failed to map 1732247552 bytes for committing reserved memory.
# Possible reasons:
#   The system is out of physical RAM or swap space
#   In 32 bit mode, the process size limit was hit
# Possible solutions:
#   Reduce memory load on the system
#   Increase physical memory or swap space
#   Check if swap backing store is full
#   Use 64 bit Java on a 64 bit OS
#   Decrease Java heap size (-Xmx/-Xms)
#   Decrease number of Java threads
#   Decrease Java thread stack sizes (-Xss)
#   Set larger code cache with -XX:ReservedCodeCacheSize=
# This output file may be truncated or incomplete.
#
#  Out of Memory Error (os_linux.cpp:2627), pid=27508, tid=0x00007f43152a3700
#
# JRE version: Java(TM) SE Runtime Environment (8.0_112-b15) (build 1.8.0_112-b15)
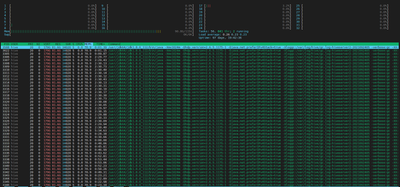
htop give the bellow view
Why all these process are created ? How to reduce memory usage ?
Created 09-29-2021 08:19 AM
- Mark as New
- Bookmark
- Subscribe
- Mute
- Subscribe to RSS Feed
- Permalink
- Report Inappropriate Content
@enirys htop lists every single thread as a separate process. Every individual connection to HS2 and HMS shows up as different processes. So, you do not need to worry about that.
As you say, you have 3 hiveserver2 nodes, see if you could reduce heap size of the hiveserver2.
You could also lower 'hive.server2.thrift.max.worker.threads' so, it does not spin up too many threads in a single hs2 node. Make sure that your workload is getting distributed across HS2s.
Created 09-30-2021 02:29 AM
- Mark as New
- Bookmark
- Subscribe
- Mute
- Subscribe to RSS Feed
- Permalink
- Report Inappropriate Content
hi @smruti
Thanks for your reply, bellow values of Hive heap size
HS2 Heap Size = 44201MB
MS Heap Size = 14733MB
Hive Client heap size = 1024MB
hive.server2.thrift.max.worker.threads = 500
Is there any recommandation/documentation rom cloudera on how to calculate set right value ?
Your last comment is very intersting, how can i check if my workload is distributed ?
Created 10-04-2021 08:50 AM
- Mark as New
- Bookmark
- Subscribe
- Mute
- Subscribe to RSS Feed
- Permalink
- Report Inappropriate Content
You could refer to the following doc for Hive tuning:
If you have other services running on the same HS2 node as well, you might want to reduce Hive heap size or move a service to a different node. Are you expecting too many connections as explained in the above doc, else you might want to bring down HS2 heap size? If you do not see too many connections, but notice high heap usage, you might want to take a heap dump as @asish mentioned, and see if there is memory leak.
Load balancing across HS2 could take place based on how you are accessing Hive. You could use zooKeeper based connection string.
Created 09-30-2021 12:00 AM
- Mark as New
- Bookmark
- Subscribe
- Mute
- Subscribe to RSS Feed
- Permalink
- Report Inappropriate Content
@enirys For a memory crash,we need heapdump.
Please append the below in JAVA_OPTIONS of hiveserver2
-XX:+HeapDumpOnOutOfMemoryError -XX:HeapDumpPath=/disk2/dumpsMake sure you provide the path correctly. Whenever there is a crash,an hprof file would be generated.
You can use Eclipse MAT or jxray to analyze the leak suspect.
You can also take heapdump on demand ,using "jmap" utility when the consumption is 80%
jmap -dump:live,format=b,file=/disk2/dumps/dump.hprof <PID of Hiveserver2>
Please let us know,if the queries are answered. Please ""Accept This a solution" if your queries are answered.
Created 09-30-2021 02:32 AM
- Mark as New
- Bookmark
- Subscribe
- Mute
- Subscribe to RSS Feed
- Permalink
- Report Inappropriate Content
Created 10-03-2021 10:40 PM
- Mark as New
- Bookmark
- Subscribe
- Mute
- Subscribe to RSS Feed
- Permalink
- Report Inappropriate Content
@enirys, Has the reply helped resolve your issue? If so, please mark the appropriate reply as the solution, as it will make it easier for others to find the answer in the future.
Regards,
Vidya Sargur,Community Manager
Was your question answered? Make sure to mark the answer as the accepted solution.
If you find a reply useful, say thanks by clicking on the thumbs up button.
Learn more about the Cloudera Community:
Created 10-04-2021 07:03 AM
- Mark as New
- Bookmark
- Subscribe
- Mute
- Subscribe to RSS Feed
- Permalink
- Report Inappropriate Content
Hi @VidyaSargur
Not my issue is not esolved yet, i'm testing @smruti's recommandations and i'm waiting for his feedback


