Support Questions
- Cloudera Community
- Support
- Support Questions
- How to export all the output/error logs for a Bulk...
- Subscribe to RSS Feed
- Mark Question as New
- Mark Question as Read
- Float this Question for Current User
- Bookmark
- Subscribe
- Mute
- Printer Friendly Page
- Subscribe to RSS Feed
- Mark Question as New
- Mark Question as Read
- Float this Question for Current User
- Bookmark
- Subscribe
- Mute
- Printer Friendly Page
How to export all the output/error logs for a Bulk operation e.g. Start all Service
- Labels:
-
Apache Ambari
Created 12-01-2015 07:09 AM
- Mark as New
- Bookmark
- Subscribe
- Mute
- Subscribe to RSS Feed
- Permalink
- Report Inappropriate Content
Suppose executed a bulk operation through Amabri UI e.g. "Start All Services" .
The requirement is -
I want to export the complete log of this operation for further analysis
One way is to find all hosts impacted by this operation , get the sub tasks executed on each hosts and then loop through them and get the logs and merge them
Is there a more simple way of getting all logs for a bulk operation done through ambari
Created 12-01-2015 09:15 AM
- Mark as New
- Bookmark
- Subscribe
- Mute
- Subscribe to RSS Feed
- Permalink
- Report Inappropriate Content
@pankaj singh Another option would be to get the log files directly from the individual nodes.
For example, use the following request to get all the task information for a request:
http://horton01.example.com:8080/api/v1/clusters/bigdata/requests/111?fields=*,tasks/Tasks/request_i...
The response looks something like this =>
"tasks" : [
    {
      "Tasks" : {
        "command" : "CUSTOM_COMMAND",
        "command_detail" : "RESTART MAPREDUCE2/MAPREDUCE2_CLIENT",
        "host_name" : "horton01.example.com",
        "id" : 1157,
        "request_id" : 111,
        "role" : "MAPREDUCE2_CLIENT",
        "status" : "COMPLETED"
      }
    },
    {
      "Tasks" : {
        "command" : "CUSTOM_COMMAND",
        "command_detail" : "RESTART MAPREDUCE2/HISTORYSERVER",
        "host_name" : "horton02.example.com",
        "id" : 1158,
        "request_id" : 111,
        "role" : "HISTORYSERVER",
        "status" : "COMPLETED"
      }
    },
The import parts are the id and the host_name
Now you can log into the host and retrieve the error and output logfile from:
- error: /var/lib/ambari-agent/data/errors-<id>.txt
- output: /var/lib/ambari-agent/data/output-<id>.txt
For Example on host horton02.example.com:
- error log: /var/lib/ambari-agent/data/errors-1158.txt
- output log: /var/lib/ambari-agent/data/output-1158.txt
Note: You might also be able to get the request and tasks ids from the Ambari Database.
Created 12-01-2015 08:24 AM
- Mark as New
- Bookmark
- Subscribe
- Mute
- Subscribe to RSS Feed
- Permalink
- Report Inappropriate Content
+ @Paul Codding and @bdurai
Once Logsearch is available you should be able to do this pretty easily from Logsearch UI because you can view all log messages across all components for the specific time window you are interested in (and filter by error level, include/exclude substrings etc). You can try a development version of it using steps here
Created 12-01-2015 08:58 AM
- Mark as New
- Bookmark
- Subscribe
- Mute
- Subscribe to RSS Feed
- Permalink
- Report Inappropriate Content
Awesome project 🙂
Created 12-01-2015 09:15 AM
- Mark as New
- Bookmark
- Subscribe
- Mute
- Subscribe to RSS Feed
- Permalink
- Report Inappropriate Content
@pankaj singh Another option would be to get the log files directly from the individual nodes.
For example, use the following request to get all the task information for a request:
http://horton01.example.com:8080/api/v1/clusters/bigdata/requests/111?fields=*,tasks/Tasks/request_i...
The response looks something like this =>
"tasks" : [
    {
      "Tasks" : {
        "command" : "CUSTOM_COMMAND",
        "command_detail" : "RESTART MAPREDUCE2/MAPREDUCE2_CLIENT",
        "host_name" : "horton01.example.com",
        "id" : 1157,
        "request_id" : 111,
        "role" : "MAPREDUCE2_CLIENT",
        "status" : "COMPLETED"
      }
    },
    {
      "Tasks" : {
        "command" : "CUSTOM_COMMAND",
        "command_detail" : "RESTART MAPREDUCE2/HISTORYSERVER",
        "host_name" : "horton02.example.com",
        "id" : 1158,
        "request_id" : 111,
        "role" : "HISTORYSERVER",
        "status" : "COMPLETED"
      }
    },
The import parts are the id and the host_name
Now you can log into the host and retrieve the error and output logfile from:
- error: /var/lib/ambari-agent/data/errors-<id>.txt
- output: /var/lib/ambari-agent/data/output-<id>.txt
For Example on host horton02.example.com:
- error log: /var/lib/ambari-agent/data/errors-1158.txt
- output log: /var/lib/ambari-agent/data/output-1158.txt
Note: You might also be able to get the request and tasks ids from the Ambari Database.
Created 12-01-2015 10:12 AM
- Mark as New
- Bookmark
- Subscribe
- Mute
- Subscribe to RSS Feed
- Permalink
- Report Inappropriate Content
It is helpful.
Created 12-01-2015 06:20 PM
- Mark as New
- Bookmark
- Subscribe
- Mute
- Subscribe to RSS Feed
- Permalink
- Report Inappropriate Content
Thanks for sharing. So this would allow users to access the same output/errors available via ambari when you start/stop a service...but its possible that the actual root cause would only be available in the service's log, right?
Created on 12-01-2015 06:48 PM - edited 08-19-2019 05:45 AM
- Mark as New
- Bookmark
- Subscribe
- Mute
- Subscribe to RSS Feed
- Permalink
- Report Inappropriate Content
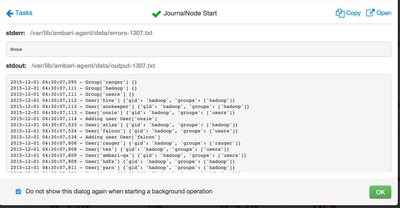
exactly, its basically the content of these two fields from ambari UI =>
As you pointed out, the actual root cause is usually available in the individual service log -> /var/log/...


