Support Questions
- Cloudera Community
- Support
- Support Questions
- Re: How to know why hbase regionserver fails?
- Subscribe to RSS Feed
- Mark Question as New
- Mark Question as Read
- Float this Question for Current User
- Bookmark
- Subscribe
- Mute
- Printer Friendly Page
- Subscribe to RSS Feed
- Mark Question as New
- Mark Question as Read
- Float this Question for Current User
- Bookmark
- Subscribe
- Mute
- Printer Friendly Page
How to know why hbase regionserver fails?
- Labels:
-
Apache HBase
Created on 03-18-2021 04:08 AM - edited 03-18-2021 04:12 AM
- Mark as New
- Bookmark
- Subscribe
- Mute
- Subscribe to RSS Feed
- Permalink
- Report Inappropriate Content
I have a question about regionservers that go to bad health when I am writing data from Spark.
My question is: how do I know (in what logs to look exactly) what the cause is of the bad health?
BACKGROUND:
My spark job processes a month of some data and writes to hbase. This runs 1/month. For most months there are no problems.
For some months (probably with slightly higher traffic), I notice the regionservers go into bad health. The master notices this and when the server goes down, it moves all regions to another regionserver, and then it becomes healthy again. But as my writing is going on, the same happens to other regionservers and eventually my spark job fails.
I am confident my error in write is not due to corrupt data (like impossible UTC time or so), since sometimes this happens and then I clearly see in my spark logs "caused by value out of bounds". Now I see
21/03/17 15:54:22 INFO client.AsyncRequestFutureImpl: id=5, table=sometable, attempt=10/11, failureCount=2048ops, last exception=org.apache.hadoop.hbase.ipc.ServerNotRunningYetException: org.apache.hadoop.hbase.ipc.ServerNotRunningYetException: Server myregionserver4,16020,1615996455401 is not running yet
LOGS:
In the logs of the master I mainly see that it starts to identify all regions on the regionserver that is dying, and moves them.
In the logs of the regionserver around the time of failure I noticed a "org.apache.hadoop.hbase.io.hfile.LruBlockCache: totalSize=3.39 GB, freeSize=2.07 GB, max=5.46 GB, blockCount=27792, accesses=0, hits=0, hitRatio=0, cachingAccesses=0, cachingHits=0, cachingHitsRatio=0,evictions=1049, evicted=0, evictedPerRun=0.0
2021-03-17 15:52:31,442 INFO " but this might be not relevant.
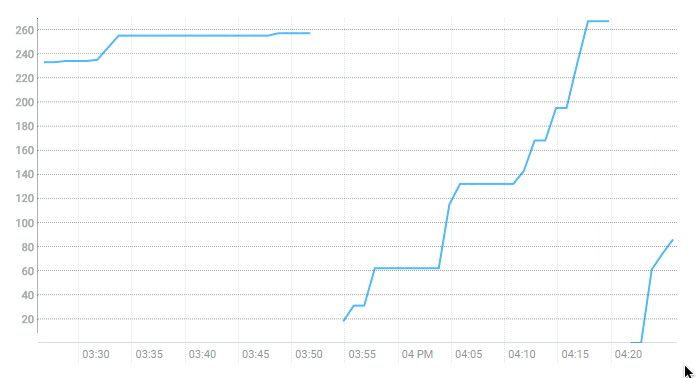
This is the behavior of the #of regions for the regionserver that dies: it dies here 2x and the number of regions collapses as they are moved.

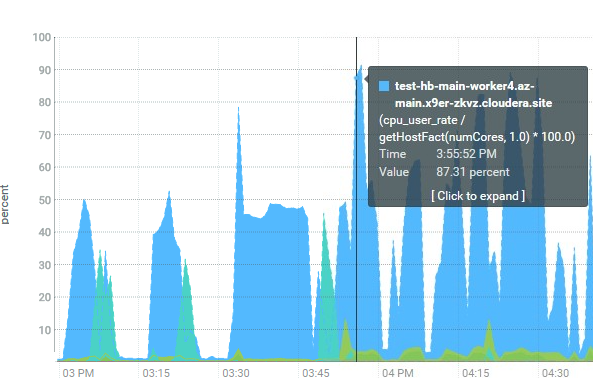
The cpu looks as follows (looks ok to me):
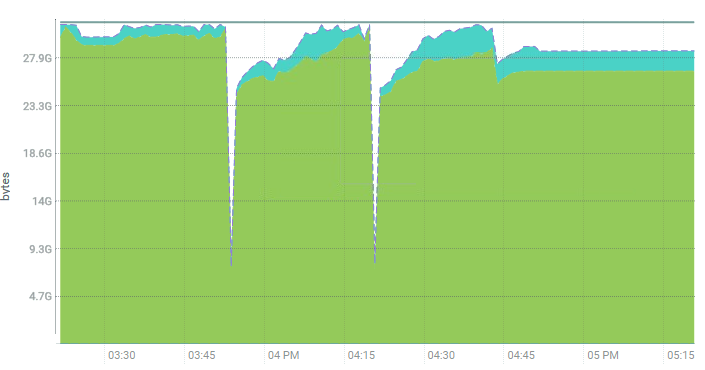
The memory looks like it comes close to the max available:
--> Maybe it fails because of memory? Like that all writes are first written to memory and the available memory has been used up? But I had expected to see this kind of error message somewhere (logs or cloudera manager).
These are the hbase settings (on CDP 7.2, hbase 2.2)
32 GB regionservers
Java Heap Size HBASE regionserver =20GB
hfile.block.cache.size =0.55
hbase.regionserver. memstore. global.size =0.25
hbase.bucketsize.cache=16GB
I am wondering how I can understand better what the reason is that the regionserver fails. Then I can change the hbase config accordingly.
Created 05-03-2021 08:03 AM
- Mark as New
- Bookmark
- Subscribe
- Mute
- Subscribe to RSS Feed
- Permalink
- Report Inappropriate Content
For future reference:
I would like to add that the reason for the observed behaviour was an overcommit of the memory.
While I am writing, the memory used of the box at some point comes so close to the maximum available on the regionservers, that the problems start. In my example at the start of writing I use about 24/31GB on the regionserver, and after a while this becomes > 30GB/31GB and eventually failures start.
I had to take a way a bit of memory from both the offheap bucketcache and a bit of the regionserver's memory. Then the process starts with 17GB/31GB used, and after writing for an hour it maxes at about 27GB, but the failure was not observed anymore.
The reason I was trying to use a much of the memory as possible is that when reading, I would like to have the best performance. Then making use of all resources, does not lead to errors. While writing however it does. Lesson learned: when going from a period that is write-intensive to a period that is read-intensive, it could be recommended to change the hbase config.
Hope this can help others!
PS: although the reply of @smdas was of very high quality and lead me to many new insights , I believe the explanation above in the current post should be marked as the solution. I sincerely want to thank you for your contribution, as your comments in combination with the current answer, will help others in the future.
Created 03-19-2021 12:01 AM
- Mark as New
- Bookmark
- Subscribe
- Mute
- Subscribe to RSS Feed
- Permalink
- Report Inappropriate Content
Hello @JB0000000000001
Thanks for using Cloudera Community. First of all, Really appreciate your detailed analysis into the concerned issue. In short, a Spark Job writes a month worth of data into HBase per a month. Intermittently, the Spark Job fails on certain month & your Team observed ServerNotRunningYetException during the concerned period.
The Primary issue appears to be RegionServer being terminated (Owing to certain reasons) & Master re-assigning the Regions to other Active RegionServers. Any Region remains in Transition (RIT) until the Region is Closed on the Now-Down-RegionServer + WAL Replay + Region Opened on New-Assigned-RegionServer. Typically, WAL Replay may be taking time causing the Spark Executor Task to be retried & failed during the concerned period. Again, this is my assumption based on the facts laid out by you.
So, What can be avoided primarily:
1. RegionServer being terminated,
2. Spark Executor Task failure.
For 2, We can definitely increase the Task failure from Default (4) to a Higher Value to ensure the collective failures is lower than the Time taken for a Region to be transitioned from 1 RS to another RS including WAL Replay. As the Job is run once a month, the above Config Change appears to be an easy way out.
For 1, I am assuming the RS are going down owing to exceeding their ZooKeeper Timeout during the period of Garbage Collection (Likely, Full GC seeing the Memory Usage). As such, We have the following pointers:
- If a RegionServer is failing with Out-Of-Memory, the Process JVM *out file would capture the same.
- If a RegionServer is failing owing to JVMPause from GC exceeding ZooKeeper Timeout, We can check the Logs for the time taken for JVMPause & the ZooKeeper Timeout. If we are seeing JVMPause exceeding ZooKeeper Timeout, Increasing the ZooKeeper Timeout to a Value higher than the Highest JVMPause would help. Negative of this Change is a RegionServer failure would be delayed in being detected.
- If JVMPause is the Cause, Review the GC Logs. Depending on CMS or G1 GC, the Logs offers a lot of details into the JVMPause & proceed accordingly. Link [1] offers a Great Info by Plumbr.
- Your MemStore is allocated 25% of the RegionServer Heap. You have written 2 Heap (32GB & 20GB), so I am unsure which is the one. Yet, the above indicates the MemStore is likely to being filled quickly. Your Team have Off-Heap Bucket Cache yet still have an extremely low value for Write Cache (MemStore). I am assuming the same must be causing the YoungGen to be filled up quickly, thereby causing MinorGC & subsequently, the FullGC may be initiated, which is causing the ZooKeeper Timeout. We can try giving a bit more MemStore Space. As your Team didn't complain of Performance, I am assuming the frequent MemStore Flush isn't causing any HDFS impact.
- Any Hot-Spotting i.e. Writes being managed by few Regions/RegionServer, thereby over-loading the RegionServer. Finally, Have your Team considered using Bulk-Loading to bypass the Memory factor in Load Jobs like you are describing.
- Smarak
[1] https://plumbr.io/handbook/garbage-collection-algorithms-implementations
Created 03-19-2021 10:22 AM
- Mark as New
- Bookmark
- Subscribe
- Mute
- Subscribe to RSS Feed
- Permalink
- Report Inappropriate Content
Hello,
When posting I had never hoped to get such a fast and remarkably clear and useful answer!Really helped for me to think more about the problem.
Hereby some comments:
SOLUTION 1 :
Indeed, allowing some more failures might be a quick fix. Will try. But true fix lies in solving #2 below probably.
SOLUTION 2:
If I understand correctly, when JVM is full, GC takes place to clean up. And if this is really urgent, the actual JVM pauses. But if this happens longer than the zookeeper timeout (=60seconds), then the regionserver is believed to have died, and the master will copy all regions to other healthy regionservers.
(I am not the expert on GC, but see that my regionserver starts with "-XX:+UseParNewGC -XX:+UseConcMarkSweepGC" )
But I had expected to see this mentioned somewere clearly in the regionserver's logs or in cloudera manager and I fail to do so. When I see my spark job saying "regionserver worker-x not available" at that exact timestamp I see no ERROR in the worker-x regionserver log.
Here some more info wrt your comments
1)regionserver out of memory, I assume in the /var/log/hbase/regionserver*out this should definitely show up as error/warning. This seems not the case.
2)I believe in case there would be a JVM pause, this would show up in the regionserver's logs "Detected pause in JVM or host machine (eg GC): pause of approximately 129793ms No GCs detected"
https://community.cloudera.com/t5/Support-Questions/Hbase-region-server-went-down-because-of-a-JVM-p...
-> I see no such message
4)note 32GB=total memory of the server; In fact I was wrong: 10GB(not 20GB)=regionserver heap size .
You make a very good point: the other 29 days of the month we want read efficiency. So that is why the memstore only receives 0.25. I should change it to 0.4% when writing and see if the error still persists.
5)I have defined my table to have 3x more shards than there are regionservers. I think this shuold avoid hotspotting.
+Bulk load indeed would bypass the need for memory. I understand it directly would create the hfiles then. But I am using some external libraries related to geostuff and not sure it is possible.
Thanks agin for your valuable contribution!
Created 03-20-2021 02:42 AM
- Mark as New
- Bookmark
- Subscribe
- Mute
- Subscribe to RSS Feed
- Permalink
- Report Inappropriate Content
Hello @JB0000000000001
Thank You for the kind words. I intended to reciprocate the level of detailing you posted in the Q, which was helpful for us. Based on your Update, Few pointers:
- The GC Flags indicates your Team is using CMS & as you mentioned, the GC Cycles JVMPause would trace the logging as you highlighted. Note that "No GCs detected" is observed when a JVMPause isn't GC induced. If your Team observe JVMPause tracing with "No GCs detected", the shared Community Post is a good pointer to evaluating Host Level concerns.
- 10GB RegionServer Heap is likely to not require 60 Seconds CleanUp, with 60 Seconds being the HBase-ZooKeeper Timeout, unless the 10GB is being filled frequently & we are having a continuous GC Cycle. In other words, if 1 FullGC is immediately followed by another FullGC (Visible in GC Logs), We wouldn't see 1 Large FullGC yet the cumulative impact is worth reviewing & require contemplation of the Eden-TenuredGeneration scale.
- While 3x Sharding than RegionServer is good for Parallelism, the Write Pattern matters based on the RowKey. If the RowKey of Table ensure Writes are being concentrated into Regions on 1 RegionServer, the concerned RegionServer would be a Bottleneck. While Writes is being carried out, Reviewing the concerned Table View via HMaster UI would offer insight into the same.
- The *out file of RegionServer would capture the OOME, yet the previous one & not the current one. Additionally, the JVMFlag can be adjusted to include +HeapDumpOnOutOfMemoryError & related parameters for HeapDump path. Link [1] covers the same.
- One pointer is to review the HMaster Logs for "Ephemeral" (Prefer Case Insensitive) associated tracing. The HMaster trace when an Ephemeral ZNode is being deleted & then, review the RegionServer (Whose Ephemeral ZNode was removed) Logs. This is based on the point wherein your team is (Maybe) reviewing the Spark Job Log for RegionServer unavailability & tracing the RS Logs. The HMaster approach is more convenient & accurate.
Do keep us posted on how things goes.
- Smarak
[1] Command-Line Options - Troubleshooting Guide for HotSpot VM (oracle.com)
Created 03-22-2021 10:54 PM
- Mark as New
- Bookmark
- Subscribe
- Mute
- Subscribe to RSS Feed
- Permalink
- Report Inappropriate Content
Hello @JB0000000000001
Once you are good with the Post & have no further queries, Kindly mark the Post as Solved to ensure we can mark the Post accordingly.
- Smarak
Created 05-03-2021 08:03 AM
- Mark as New
- Bookmark
- Subscribe
- Mute
- Subscribe to RSS Feed
- Permalink
- Report Inappropriate Content
For future reference:
I would like to add that the reason for the observed behaviour was an overcommit of the memory.
While I am writing, the memory used of the box at some point comes so close to the maximum available on the regionservers, that the problems start. In my example at the start of writing I use about 24/31GB on the regionserver, and after a while this becomes > 30GB/31GB and eventually failures start.
I had to take a way a bit of memory from both the offheap bucketcache and a bit of the regionserver's memory. Then the process starts with 17GB/31GB used, and after writing for an hour it maxes at about 27GB, but the failure was not observed anymore.
The reason I was trying to use a much of the memory as possible is that when reading, I would like to have the best performance. Then making use of all resources, does not lead to errors. While writing however it does. Lesson learned: when going from a period that is write-intensive to a period that is read-intensive, it could be recommended to change the hbase config.
Hope this can help others!
PS: although the reply of @smdas was of very high quality and lead me to many new insights , I believe the explanation above in the current post should be marked as the solution. I sincerely want to thank you for your contribution, as your comments in combination with the current answer, will help others in the future.


