Support Questions
- Cloudera Community
- Support
- Support Questions
- Re: Monitoring nifi back pressure threshold and tr...
- Subscribe to RSS Feed
- Mark Question as New
- Mark Question as Read
- Float this Question for Current User
- Bookmark
- Subscribe
- Mute
- Printer Friendly Page
- Subscribe to RSS Feed
- Mark Question as New
- Mark Question as Read
- Float this Question for Current User
- Bookmark
- Subscribe
- Mute
- Printer Friendly Page
Monitoring nifi back pressure threshold and trigger an email
- Labels:
-
Apache NiFi
Created on 02-13-2018 11:48 PM - edited 08-17-2019 07:49 PM
- Mark as New
- Bookmark
- Subscribe
- Mute
- Subscribe to RSS Feed
- Permalink
- Report Inappropriate Content
Hi All,
Thanks a lot to this awesome community.
I am trying to monitor the size of the queues. I want trigger an email once the queue is 80% full by size.
Is there a way I can achieve this, this post hints
https://community.hortonworks.com/articles/83610/nifi-rest-api-flowfile-count-monitoring.html
but it involves a lot of processors, and my dataflows have a lot of connections. So monitor each connection with 5 processors will not be viable option.
Thanks
Dhiren
Created 02-14-2018 01:24 AM
- Mark as New
- Bookmark
- Subscribe
- Mute
- Subscribe to RSS Feed
- Permalink
- Report Inappropriate Content
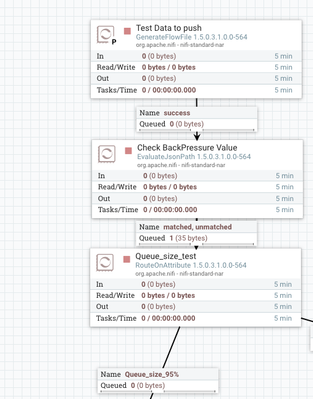
The post uses UpdateAttribute to set the CONNECTION_UUID attribute, if you want to monitor more, you can change the upstream flow to get the connection UUID for all connections. For the root process group, you should be able to do this with InvokeHttp for the endpoint /process-groups/root/connections, then parse the JSON and probably split it with SplitJson and get the URL into an attribute for each flow file with EvaluateJsonPath. Then you can use UpdateAttribute (or probably just EvaluateJsonPath) to set the UUID from the incoming JSON document, and then let the rest of the flow "do its thing". You can route/merge later on the UUID if necessary.
Created on 02-14-2018 01:38 AM - edited 08-17-2019 07:49 PM
- Mark as New
- Bookmark
- Subscribe
- Mute
- Subscribe to RSS Feed
- Permalink
- Report Inappropriate Content
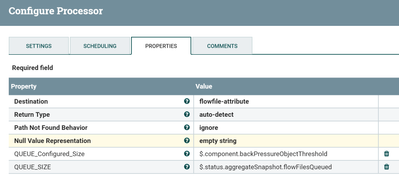
You can extract the queue configurations i.e backPressureDataSizeThreshold (or) backPressureObjectThreshold from json response keep them as attributes by using evaluate json processor.
QUEUE_Configured_Size
$.component.backPressureObjectThreshold
Compare the configured size with how many flowfiles are queued
QUEUE_SIZE
$.status.aggregateSnapshot.flowFilesQueued
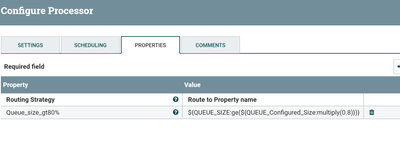
Route on Attribute Configs:-
Queue_size_ge80%
${QUEUE_SIZE:ge(${QUEUE_Configured_Size:multiply(0.8)})}so we are checking the queue_size(how many flowfiles are queued) greater than equal to queue_configured_size multiply with 0.8(means 80%), if the flowfiles queued are greater than or equal to 80% we are going to keep those flowfiles into Queue_size_ge80% relation.
Example:-
if my queue configured to have 10 objects then if the queued flowfiles are greater than equal to 8 then the ff routes to Queue_size_ge80% property.
2.To get all connection UUID's use the below api with recursive it will shows up all the connection id's
curl -i -X GET http://localhost:9090/nifi-api/flow/process-groups/root/status?recursive=true
then create a script (or) use a processor that can extract all the connection-id's(connectionStatusSnapshot.id) from json response then use those connection id's in your monitoring the queue size.
Created on 04-10-2019 06:24 PM - edited 08-17-2019 07:49 PM
- Mark as New
- Bookmark
- Subscribe
- Mute
- Subscribe to RSS Feed
- Permalink
- Report Inappropriate Content
Hi @@dhieru singh
Thank you for the post , but I am unable to get the values of
- $.component.backPressureObjectThreshold
- $.status.aggregateSnapshot.flowFilesQueued after processing the EvaluateJsonPath.
Created 10-08-2018 02:10 PM
- Mark as New
- Bookmark
- Subscribe
- Mute
- Subscribe to RSS Feed
- Permalink
- Report Inappropriate Content
Hi guys! I don't understand where are you find or how are you think up with these properties like - backPressureDataSizeThreshold (or) backPressureObjectThreshold ?
Created 10-08-2018 02:13 PM
- Mark as New
- Bookmark
- Subscribe
- Mute
- Subscribe to RSS Feed
- Permalink
- Report Inappropriate Content
A good place to start understanding these properties is in the NiFi Admin Guide:
https://nifi.apache.org/docs/nifi-docs/html/user-guide.html#back-pressure
Created 01-08-2019 04:27 PM
- Mark as New
- Bookmark
- Subscribe
- Mute
- Subscribe to RSS Feed
- Permalink
- Report Inappropriate Content
so Im a bit confused. I want to monitor the queue(s) and create and Alert. I understand this post and the Nifiworkflow but is it the right way?
Alert: send data to Prometheus and from there read and display in Alerta.
Im not sure whats the correct way. as I read there are ReportingTasks which can also be used to do something similar.
e.g SiteToSiteStatusReportingTask can be used to get connection status?
Also how to send data to Prometheus? Some Post processor or ReportingTask or something custom?
Could anyone please explain a bit?


