Support Questions
- Cloudera Community
- Support
- Support Questions
- Please help me to get count of particular field v...
- Subscribe to RSS Feed
- Mark Question as New
- Mark Question as Read
- Float this Question for Current User
- Bookmark
- Subscribe
- Mute
- Printer Friendly Page
- Subscribe to RSS Feed
- Mark Question as New
- Mark Question as Read
- Float this Question for Current User
- Bookmark
- Subscribe
- Mute
- Printer Friendly Page
Please help me to get count of particular field value in json file using nifi
- Labels:
-
Apache NiFi
Created 06-18-2018 03:13 PM
- Mark as New
- Bookmark
- Subscribe
- Mute
- Subscribe to RSS Feed
- Permalink
- Report Inappropriate Content
Created on 06-19-2018 07:57 PM - edited 08-17-2019 06:48 PM
- Mark as New
- Bookmark
- Subscribe
- Mute
- Subscribe to RSS Feed
- Permalink
- Report Inappropriate Content
Hi @Suresh Dendukuri!
I made a test here, and may serve to you:
I have a file called ambari.json with following content:
{
  "AMBARI_METRICS": {
    "service": [
      {
        "name": "metrics_monitor_process_percent",
        "label": "Percent Metrics Monitors Available",
        "description": "This alert is triggered if a percentage of Metrics Monitor processes are not up and listening on the network for the configured warning and critical thresholds.",
        "interval": 1,
        "scope": "SERVICE",
        "enabled": true,
        "source": {
          "type": "AGGREGATE",
          "alert_name": "ams_metrics_monitor_process",
          "reporting": {
            "ok": {
              "text": "affected: [{1}], total: [{0}]"
            },
            "warning": {
              "text": "affected: [{1}], total: [{0}]",
              "value": 10
            },
            "critical": {
              "text": "affected: [{1}], total: [{0}]",
              "value": 30
            },
            "units" : "%",
            "type": "PERCENT"
          }
        }
      }
    ],
    "METRICS_COLLECTOR": [
      {
        "name": "ams_metrics_collector_autostart",
        "label": "Metrics Collector - Auto-Restart Status",
        "description": "This alert is triggered if the Metrics Collector has been restarted automatically too frequently in last one hour. By default, a Warning alert is triggered if restarted twice in one hour and a Critical alert is triggered if restarted 4 or more times in one hour.",
        "interval": 1,
        "scope": "ANY",
        "enabled": true,
        "source": {
          "type": "RECOVERY",
          "reporting": {
            "ok": {
              "text": "Metrics Collector has not been auto-started and is running normally{0}."
            },
            "warning": {
              "text": "Metrics Collector has been auto-started {1} times{0}.",
              "count": 2
            },
            "critical": {
              "text": "Metrics Collector has been auto-started {1} times{0}.",
              "count": 4
            }
          }
        }
      },
      {
        "name": "ams_metrics_collector_process",
        "label": "Metrics Collector Process",
        "description": "This alert is triggered if the Metrics Collector cannot be confirmed to be up and listening on the configured port for number of seconds equal to threshold.",
        "interval": 1,
        "scope": "ANY",
        "enabled": true,
        "source": {
          "type": "PORT",
          "uri": "{{ams-site/timeline.metrics.service.webapp.address}}",
          "default_port": 6188,
          "reporting": {
            "ok": {
              "text": "TCP OK - {0:.3f}s response on port {1}"
            },
            "warning": {
              "text": "TCP OK - {0:.3f}s response on port {1}",
              "value": 1.5
            },
            "critical": {
              "text": "Connection failed: {0} to {1}:{2}",
              "value": 5.0
            }
          }
        }
      },
      {
        "name": "ams_metrics_collector_hbase_master_process",
        "label": "Metrics Collector - HBase Master Process",
        "description": "This alert is triggered if the Metrics Collector's HBase master processes cannot be confirmed to be up and listening on the network for the configured critical threshold, given in seconds.",
        "interval": 1,
        "scope": "ANY",
        "source": {
          "type": "PORT",
          "uri": "{{ams-hbase-site/hbase.master.info.port}}",
          "default_port": 61310,
          "reporting": {
            "ok": {
              "text": "TCP OK - {0:.3f}s response on port {1}"
            },
            "warning": {
              "text": "TCP OK - {0:.3f}s response on port {1}",
              "value": 1.5
            },
            "critical": {
              "text": "Connection failed: {0} to {1}:{2}",
              "value": 5.0
            }
          }
        }
      },
      {
        "name": "ams_metrics_collector_hbase_master_cpu",
        "label": "Metrics Collector - HBase Master CPU Utilization",
        "description": "This host-level alert is triggered if CPU utilization of the Metrics Collector's HBase Master exceeds certain warning and critical thresholds. It checks the HBase Master JMX Servlet for the SystemCPULoad property. The threshold values are in percent.",
        "interval": 5,
        "scope": "ANY",
        "enabled": true,
        "source": {
          "type": "METRIC",
          "uri": {
            "http": "{{ams-hbase-site/hbase.master.info.port}}",
            "default_port": 61310,
            "connection_timeout": 5.0
          },
          "reporting": {
            "ok": {
              "text": "{1} CPU, load {0:.1%}"
            },
            "warning": {
              "text": "{1} CPU, load {0:.1%}",
              "value": 200
            },
            "critical": {
              "text": "{1} CPU, load {0:.1%}",
              "value": 250
            },
            "units" : "%",
            "type": "PERCENT"
          },
          "jmx": {
            "property_list": [
              "java.lang:type=OperatingSystem/SystemCpuLoad",
              "java.lang:type=OperatingSystem/AvailableProcessors"
            ],
            "value": "{0} * 100"
          }
        }
      }
    ],
    "METRICS_MONITOR": [
      {
        "name": "ams_metrics_monitor_process",
        "label": "Metrics Monitor Status",
        "description": "This alert indicates the status of the Metrics Monitor process as determined by the monitor status script.",
        "interval": 1,
        "scope": "ANY",
        "source": {
          "type": "SCRIPT",
          "path": "AMBARI_METRICS/0.1.0/package/alerts/alert_ambari_metrics_monitor.py"
        }
      }
    ],
    "METRICS_GRAFANA": [
      {
        "name": "grafana_webui",
        "label": "Grafana Web UI",
        "description": "This host-level alert is triggered if the Grafana Web UI is unreachable.",
        "interval": 1,
        "scope": "ANY",
        "source": {
          "type": "WEB",
          "uri": {
              "http": "{{ams-grafana-ini/port}}",
              "https": "{{ams-grafana-ini/port}}",
              "https_property": "{{ams-grafana-ini/protocol}}",
              "https_property_value": "https",
              "connection_timeout": 5.0,
              "default_port": 3000
          },
          "reporting": {
              "ok": {
                  "text": "HTTP {0} response in {2:.3f}s"
              },
              "warning":{
                  "text": "HTTP {0} response from {1} in {2:.3f}s ({3})"
              },
              "critical": {
                  "text": "Connection failed to {1} ({3})"
              }
          }
        }
      }
    ]
  }
}
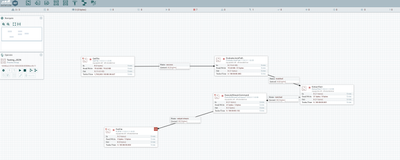
And I want to sum the values from the value attrib under the AMBARI_METRICS.service.[0].source.reporting.*.value, so in my flow I'm using GETFILE > EVALUATEJSONPATH > EXTRACTTEXT > EXECUTESTREAMCOMMAND > PUTFIL.
In My GetFile I've:
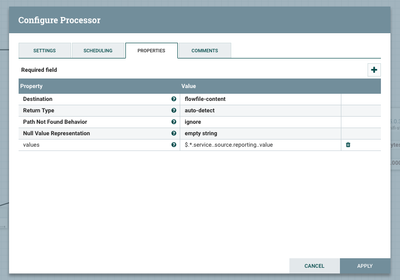
In the EvaluateJsonPath:
In the
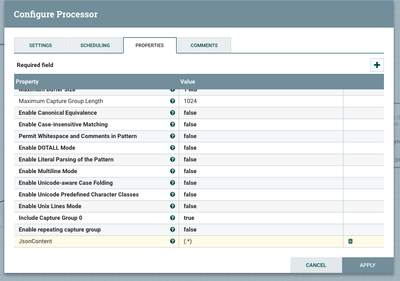
In the ExtractText
In the ExecuteStreamCommand:
And at the end, my putFile.
And here's the content of my shell script that Calculates each value from the value attribute and summarize to PutFile Processor.
#!/bin/bash
echo $@ | tr ',' '\n' | grep -o -E '[0-9]+' | paste -sd+ | b
Hope this helps!
Created on 06-18-2018 11:37 PM - edited 08-17-2019 06:49 PM
- Mark as New
- Bookmark
- Subscribe
- Mute
- Subscribe to RSS Feed
- Permalink
- Report Inappropriate Content
You can use the following flow:
GetFile > EvaluateJsonPath > ExecuteStreamCommand or ExecuteScriptCommand > PutFile
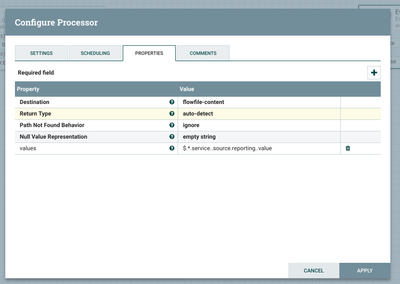
On EvaluateJsonPath you will add the attributes from your json content, follows attached my example.
Ps: In my case i'm getting all value attribute from my json file under the *.service..source.reporting.. path.
Hope this helps!
Created 06-19-2018 01:38 AM
- Mark as New
- Bookmark
- Subscribe
- Mute
- Subscribe to RSS Feed
- Permalink
- Report Inappropriate Content
Thanks for your response. . But how to get count of one field from json file. for Example : file has empid,deptid,salary fields , how to get total records and number of employees ?
Apreciate your time and help
Created 06-19-2018 01:38 AM
- Mark as New
- Bookmark
- Subscribe
- Mute
- Subscribe to RSS Feed
- Permalink
- Report Inappropriate Content
Thanks for your response. . But how to get count of one field from json file. for Example : file has empid,deptid,salary fields , how to get total records and number of employees from each department
Apreciate your time and help
Created on 06-19-2018 07:57 PM - edited 08-17-2019 06:48 PM
- Mark as New
- Bookmark
- Subscribe
- Mute
- Subscribe to RSS Feed
- Permalink
- Report Inappropriate Content
Hi @Suresh Dendukuri!
I made a test here, and may serve to you:
I have a file called ambari.json with following content:
{
  "AMBARI_METRICS": {
    "service": [
      {
        "name": "metrics_monitor_process_percent",
        "label": "Percent Metrics Monitors Available",
        "description": "This alert is triggered if a percentage of Metrics Monitor processes are not up and listening on the network for the configured warning and critical thresholds.",
        "interval": 1,
        "scope": "SERVICE",
        "enabled": true,
        "source": {
          "type": "AGGREGATE",
          "alert_name": "ams_metrics_monitor_process",
          "reporting": {
            "ok": {
              "text": "affected: [{1}], total: [{0}]"
            },
            "warning": {
              "text": "affected: [{1}], total: [{0}]",
              "value": 10
            },
            "critical": {
              "text": "affected: [{1}], total: [{0}]",
              "value": 30
            },
            "units" : "%",
            "type": "PERCENT"
          }
        }
      }
    ],
    "METRICS_COLLECTOR": [
      {
        "name": "ams_metrics_collector_autostart",
        "label": "Metrics Collector - Auto-Restart Status",
        "description": "This alert is triggered if the Metrics Collector has been restarted automatically too frequently in last one hour. By default, a Warning alert is triggered if restarted twice in one hour and a Critical alert is triggered if restarted 4 or more times in one hour.",
        "interval": 1,
        "scope": "ANY",
        "enabled": true,
        "source": {
          "type": "RECOVERY",
          "reporting": {
            "ok": {
              "text": "Metrics Collector has not been auto-started and is running normally{0}."
            },
            "warning": {
              "text": "Metrics Collector has been auto-started {1} times{0}.",
              "count": 2
            },
            "critical": {
              "text": "Metrics Collector has been auto-started {1} times{0}.",
              "count": 4
            }
          }
        }
      },
      {
        "name": "ams_metrics_collector_process",
        "label": "Metrics Collector Process",
        "description": "This alert is triggered if the Metrics Collector cannot be confirmed to be up and listening on the configured port for number of seconds equal to threshold.",
        "interval": 1,
        "scope": "ANY",
        "enabled": true,
        "source": {
          "type": "PORT",
          "uri": "{{ams-site/timeline.metrics.service.webapp.address}}",
          "default_port": 6188,
          "reporting": {
            "ok": {
              "text": "TCP OK - {0:.3f}s response on port {1}"
            },
            "warning": {
              "text": "TCP OK - {0:.3f}s response on port {1}",
              "value": 1.5
            },
            "critical": {
              "text": "Connection failed: {0} to {1}:{2}",
              "value": 5.0
            }
          }
        }
      },
      {
        "name": "ams_metrics_collector_hbase_master_process",
        "label": "Metrics Collector - HBase Master Process",
        "description": "This alert is triggered if the Metrics Collector's HBase master processes cannot be confirmed to be up and listening on the network for the configured critical threshold, given in seconds.",
        "interval": 1,
        "scope": "ANY",
        "source": {
          "type": "PORT",
          "uri": "{{ams-hbase-site/hbase.master.info.port}}",
          "default_port": 61310,
          "reporting": {
            "ok": {
              "text": "TCP OK - {0:.3f}s response on port {1}"
            },
            "warning": {
              "text": "TCP OK - {0:.3f}s response on port {1}",
              "value": 1.5
            },
            "critical": {
              "text": "Connection failed: {0} to {1}:{2}",
              "value": 5.0
            }
          }
        }
      },
      {
        "name": "ams_metrics_collector_hbase_master_cpu",
        "label": "Metrics Collector - HBase Master CPU Utilization",
        "description": "This host-level alert is triggered if CPU utilization of the Metrics Collector's HBase Master exceeds certain warning and critical thresholds. It checks the HBase Master JMX Servlet for the SystemCPULoad property. The threshold values are in percent.",
        "interval": 5,
        "scope": "ANY",
        "enabled": true,
        "source": {
          "type": "METRIC",
          "uri": {
            "http": "{{ams-hbase-site/hbase.master.info.port}}",
            "default_port": 61310,
            "connection_timeout": 5.0
          },
          "reporting": {
            "ok": {
              "text": "{1} CPU, load {0:.1%}"
            },
            "warning": {
              "text": "{1} CPU, load {0:.1%}",
              "value": 200
            },
            "critical": {
              "text": "{1} CPU, load {0:.1%}",
              "value": 250
            },
            "units" : "%",
            "type": "PERCENT"
          },
          "jmx": {
            "property_list": [
              "java.lang:type=OperatingSystem/SystemCpuLoad",
              "java.lang:type=OperatingSystem/AvailableProcessors"
            ],
            "value": "{0} * 100"
          }
        }
      }
    ],
    "METRICS_MONITOR": [
      {
        "name": "ams_metrics_monitor_process",
        "label": "Metrics Monitor Status",
        "description": "This alert indicates the status of the Metrics Monitor process as determined by the monitor status script.",
        "interval": 1,
        "scope": "ANY",
        "source": {
          "type": "SCRIPT",
          "path": "AMBARI_METRICS/0.1.0/package/alerts/alert_ambari_metrics_monitor.py"
        }
      }
    ],
    "METRICS_GRAFANA": [
      {
        "name": "grafana_webui",
        "label": "Grafana Web UI",
        "description": "This host-level alert is triggered if the Grafana Web UI is unreachable.",
        "interval": 1,
        "scope": "ANY",
        "source": {
          "type": "WEB",
          "uri": {
              "http": "{{ams-grafana-ini/port}}",
              "https": "{{ams-grafana-ini/port}}",
              "https_property": "{{ams-grafana-ini/protocol}}",
              "https_property_value": "https",
              "connection_timeout": 5.0,
              "default_port": 3000
          },
          "reporting": {
              "ok": {
                  "text": "HTTP {0} response in {2:.3f}s"
              },
              "warning":{
                  "text": "HTTP {0} response from {1} in {2:.3f}s ({3})"
              },
              "critical": {
                  "text": "Connection failed to {1} ({3})"
              }
          }
        }
      }
    ]
  }
}
And I want to sum the values from the value attrib under the AMBARI_METRICS.service.[0].source.reporting.*.value, so in my flow I'm using GETFILE > EVALUATEJSONPATH > EXTRACTTEXT > EXECUTESTREAMCOMMAND > PUTFIL.
In My GetFile I've:
In the EvaluateJsonPath:
In the
In the ExtractText
In the ExecuteStreamCommand:
And at the end, my putFile.
And here's the content of my shell script that Calculates each value from the value attribute and summarize to PutFile Processor.
#!/bin/bash
echo $@ | tr ',' '\n' | grep -o -E '[0-9]+' | paste -sd+ | b
Hope this helps!
Created 06-20-2018 12:47 AM
- Mark as New
- Bookmark
- Subscribe
- Mute
- Subscribe to RSS Feed
- Permalink
- Report Inappropriate Content
Thanks for your time and support . Your solution is help full to me . here we are running on windows machine .
I was used below flow but it was not working
Getmongo->update attribute->queryrecord->mergecontent-> query record(this was not working) -->putfile
flowfile structure(Json file)
{
projectshortname:AAAA
projectid:5885858
caseid:1111
},
{
projectshortname:BBBB
projectid:5885858
caseid:222222
}
query record used below query
with prj as ( select projectshortname,projectid,caseid, count(caseid) as cnt FROM FLOWFILE group by projectshortname,projectid,caseid ) select projectshortname,projectid,caseid, cnt, SUM(cnt) OVER () AS total_records from prj order by caseid
mergecontent- used for combining all flow files
queryrecord: applying query record for the consolidated file
but this was not working all the records in the file
Created 06-20-2018 06:18 PM
- Mark as New
- Bookmark
- Subscribe
- Mute
- Subscribe to RSS Feed
- Permalink
- Report Inappropriate Content
Hi @Suresh Dendukuri!
Glad to hear that was helpful 🙂
So, backing to your new problem, i'd kindly ask to you, to open a new question in HCC (cause separating different issues helps other HCC user to search for a specific problem) 🙂
But, just lemme get better into your problem, the query listed isn't working? If so, does Nifi showing error? Or just the result isn't the expected?
Thanks


